|

NZD/JPY Price Analysis: Consolidating in neutral terrain, 20-day SMA remains the one to watch

  • NZD/JPY continues to trade sideways using the 20-day SMA as a support.
  • RSI and MACD are sending mixed signals.
  • Buyers and sellers remain indecisive which favours a neutral outlook.

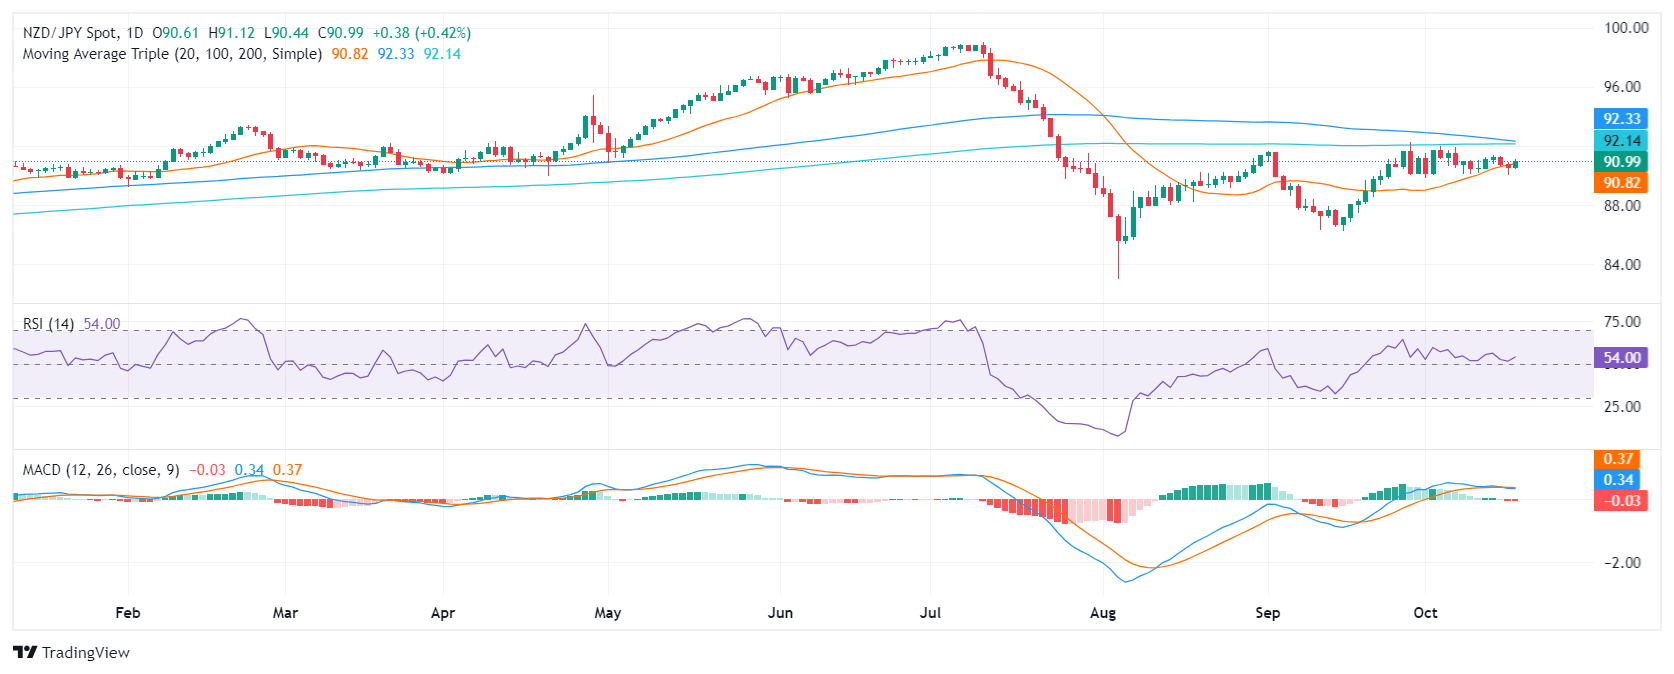
In Thursday's session, the NZD/JPY pair rose by 0.45% to 90.95, continuing the sideways movement seen in the past few sessions.

The daily Relative Strength Index (RSI) is currently at 54, indicating that the pair is in neutral territory. However, the RSI is rising, suggesting that buying pressure is steady. In addition, the Moving Average Convergence Divergence (MACD) histogram is red confirming a bearish presence.

Regarding the overall outlook, the 20,100 and 200-day SMAs seem to be converging to the 92.00 area to perform a crossover which might define the short-term trajectory. In the meantime, the 20-day SMA continues serving as a solid support and bears continue to battle with it and seem to be struggling to conquer it. Overall price action continue to side-ways trade and neither bulls nor bears are clear dominants, at least for the short term.

Support levels can be found at 90.50, 90.30 and 90.00, while resistance levels lie at 92.00, 92.50 and 93.00.

NZD/JPY daily chart
Author

Patricio Martín

Patricio is an economist from Argentina passionate about global finance and understanding the daily movements of the markets.


More from Patricio Martín
Share:

Editor's Picks

British Pound eases to 1.3450 area following downwardly revised Manufacturing PMI data

The British Pound is trimming previous gains against the US Dollar on Monday, returning to the mid-range of the 1.3400s down from fresh seven-week highs, above 1.3500 earlier on the day. Weaker-than-expected UK manufacturing data added pressure on the Pound, which rallied at the Asian session opening, amid news of a halt to the hostilities in Iran.

EUR/USD challenges 1.1500 on Dollar’s recovery

EUR/USD now accelerates its downtrend and comes closer to the 1.1500 level on Monday. The pair’s correction follows the decent improvement in the US Dollar amid solid data US releases and easing concerns on the geopolitical front.

Gold: The $4,000 mark holds the downside for now

Gold adds to Friday’s pullback, although it remains well underpinned by the key $4,000 threshold per troy ounce on Monday. The US Dollar’s inconclusive price action seems enough to cap the yellow metal’s potential upside, although renewed hopes for a US-Iran peace deal and fading expectations of a Fed rate hike could limit the Greenback’s recovery.

Week ahead: US payrolls report and AI earnings to keep investors on edge

After the Fed decision, NFP report awaited for more rate hike clues. Employment also on the agenda in Canada and New Zealand. Chinese trade and Japanese wage data to be watched too. But Iran and AI headlines to remain in driver’s seat for risk sentiment.

The Bitcoin futures yield collapse: Once over 20%, now less than Treasury notes
Once a goldmine for carry traders, Bitcoin futures have flipped, consistently underperforming plain‑vanilla U.S. Treasuries every month since February. Carry trades consistently yielded 20% or more across regulated and unregulated crypto exchanges during the 2021 bull market. The strategy involved shorting Bitcoin futures while simultaneously buying a spot exchange-traded fund (ETF).
9-3: Is the Federal Reserve’s vote tally Warsh's new forward guidance?
The rate did not move. Neither did the statement, and that’s the more interesting fact. Set the July 29 Federal Open Market Committee (FOMC) statement beside the one issued on June 17, and the two documents are identical apart from a single verb and a paragraph at the bottom naming three dissenters.