|

NZD/JPY Price Analysis: Bullish momentum fading, downside risk emerging

  • NZD/JPY has been in a sideways movement for the past few sessions, with sharp losses in Tuesday's session.
  • RSI is declining sharply, MACD histogram is green and decreasing, suggesting that buying pressure is declining.
  • A breakdown below 90.00 could confirm further downside potential.

The NZD/JPY pair declined by 0.60% to 90.70 in Tuesday's session and threatens with a reversal in the recent bullish movements.

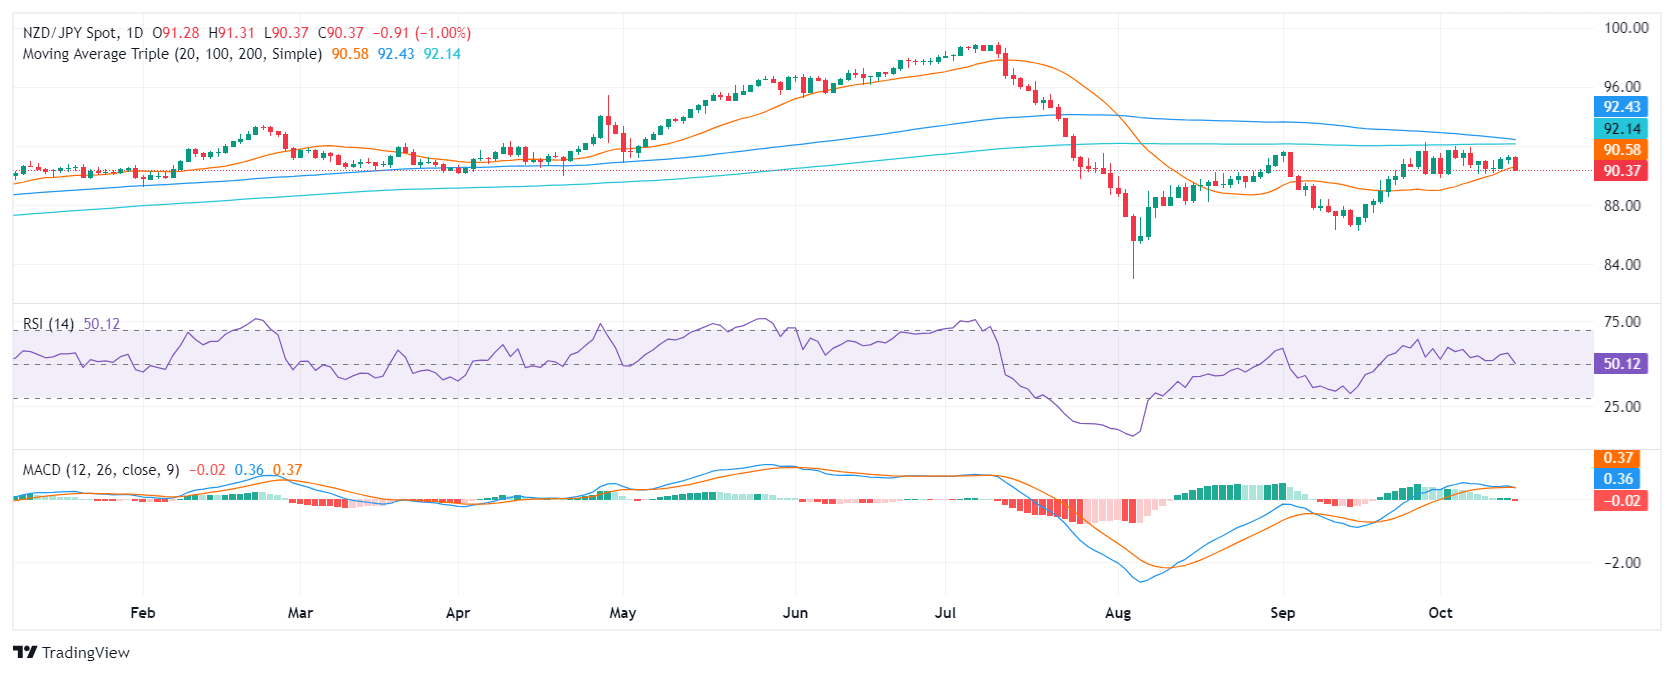
The daily Relative Strength Index (RSI) is currently at around 52, indicating that the pair is in the positive area. However, the RSI is declining sharply, suggesting that buying pressure is declining. The Moving Average Convergence Divergence (MACD) histogram is green and decreasing, suggesting that buying pressure is declining. The MACD histogram direction is green and decreasing, confirming the bearish momentum.

The 90.00 level is crucial for the pair’s near-term outlook. A breakdown below this support could open the door to additional losses, potentially targeting the next psychological support at 89.50. However, if the pair finds support above this level and buyers step in, a reversal could occur, targeting resistances at 91.00 and potentially 92.00, where the 20, 100, and 200-day simple moving averages converge.

NZD/JPY daily chart

Author

Patricio Martín

Patricio is an economist from Argentina passionate about global finance and understanding the daily movements of the markets.

More from Patricio Martín
Share:

Markets move fast. We move first.

Orange Juice Newsletter brings you expert driven insights - not headlines. Every day on your inbox.

By subscribing you agree to our Terms and conditions.

Editor's Picks

EUR/USD trades with negative bias around 1.1730 amid recovering USD; downside seems limited

The EUR/USD pair kicks off the new week on a softer note, though it remains within striking distance of the highest level since early October, touched last Thursday. Spot prices currently trade around the 1.1730 region, down less than 0.10% for the day.

GBP/USD holds steady above mid-1.3300s as traders await key data and BoE this week

The GBP/USD pair remains on the defensive during the Asian session on Monday, though it lacks bearish conviction and holds above the 200-day Simple Moving Average pivotal support. Spot prices currently trade around the 1.3360 region, nearly unchanged for the day.

Gold retains bullish bias ahead of this week’s key US macro releases

Gold attracts buyers for the fifth straight day and climbs to the $4,330 region during the Asian session on Monday. The commodity remains well within striking distance of its highest level since October 21, touched on Friday, and seems poised to appreciate further amid a supportive fundamental backdrop. 

Solana consolidates as spot ETF inflows near $1 billion signal institutional dip-buying

Solana price hovers above $131 at the time of writing on Monday, nearing the upper boundary of a falling wedge pattern, awaiting a decisive breakout. On the institutional side, demand for spot Solana Exchange-Traded Funds remained firm, pushing total assets under management to nearly $1 billion since launch. 

Big week ends with big doubts

The S&P 500 continued to push higher yesterday as the US 2-year yield wavered around the 3.50% mark following a Federal Reserve (Fed) rate cut earlier this week that was ultimately perceived as not that hawkish after all. The cut is especially boosting the non-tech pockets of the market.

Solana Price Forecast: SOL consolidates as spot ETF inflows near $1 billion signal institutional dip-buying

Solana (SOL) price hovers above $131 at the time of writing on Monday, nearing the upper boundary of a falling wedge pattern, awaiting a decisive breakout.