|

NZD/JPY Price Analysis: Bears seize control, key 20-day SMA broken breached

  • NZD/JPY ended Thursday's session with a significant decline.
  • The bears successfully pushed the pair below the crucial 20-day SMA, signaling a shift in command.

In Thursday's trading session, the NZD/JPY pair dropped substantially, losing 1.40% to land at 96.80. The pair slipped below the 20-day Simple Moving Average (SMA) of 97.70, indicating a negative outlook in the short-term as the outlook is now somewhat bearish at least for the short-term.

On the daily chart, the Relative Strength Index (RSI) plummeted to 44. This swift shift towards negative territory suggests a decline in market momentum, and it is important to note that the RSI shifted from nearly overbought terrain to below the middle point. The Moving Average Convergence Divergence (MACD) also adds weight to this bearish scenario, registering rising red bars indicative of decreased buying momentum.

NZD/JPY daily chart

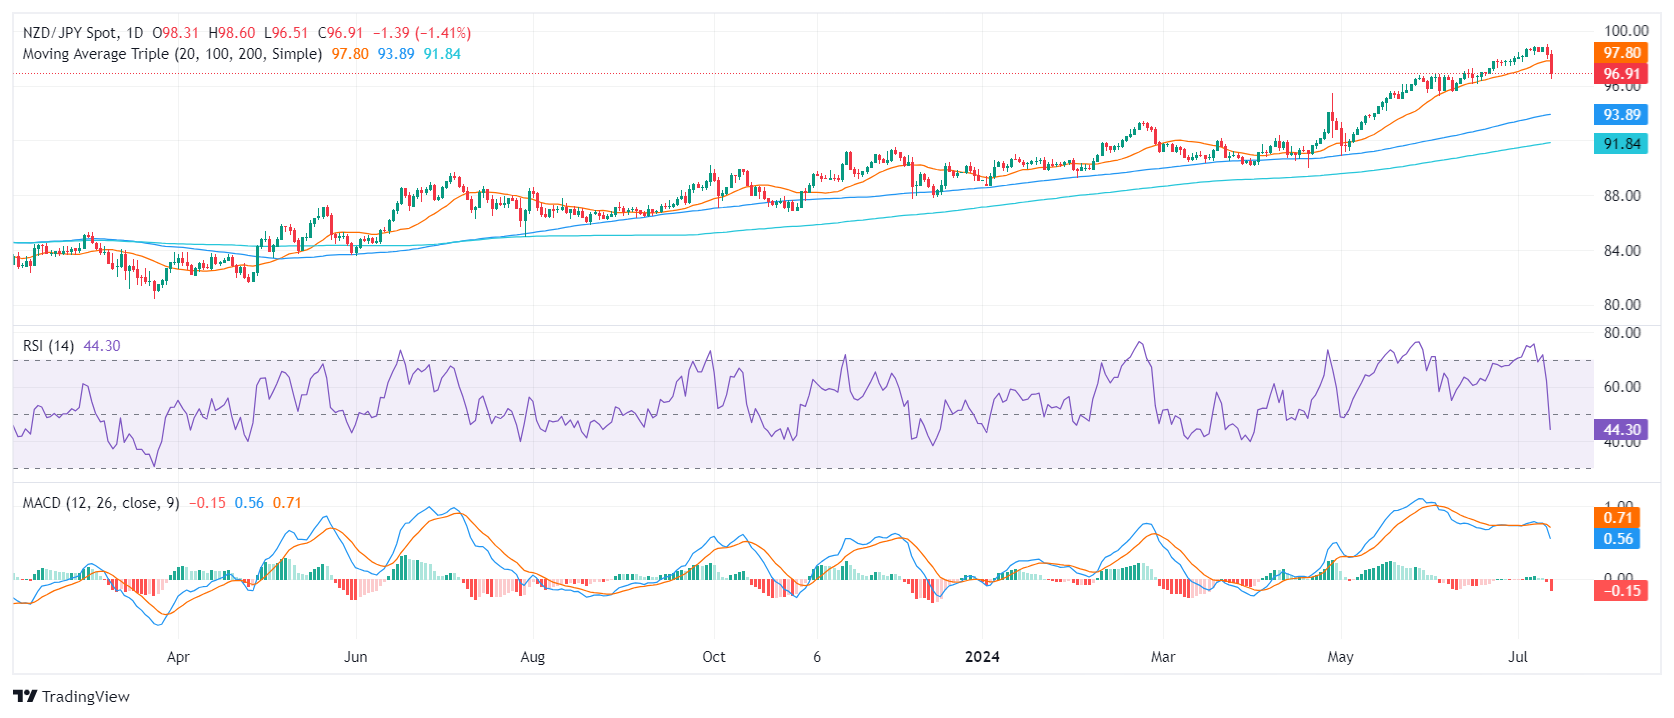
In light of the bearish turn, immediate support levels are now set at 96.50, 96.00, and further down to 95.00. In contrast, resistance is now likely to be encountered at previous support levels of 97.00, 97.70 (20-day SMA), and 98.00.

Author

Patricio Martín

Patricio is an economist from Argentina passionate about global finance and understanding the daily movements of the markets.

More from Patricio Martín
Share:

Editor's Picks

EUR/USD looks sidelined around 1.1850

EUR/USD remains on the back foot, extending its bearish tone and sliding towards the 1.1850 area to print fresh daily lows on Monday. The move lower comes as the US Dollar gathers modest traction, with thin liquidity and subdued volatility amplifying price swings amid the US market holiday.

GBP/USD flirts with daily lows near 1.3630

GBP/USD has quickly given back Friday’s solid gains, turning lower at the start of the week and drifting back towards the 1.3630 area. The focus now shifts squarely to Tuesday’s UK labour market report, which is likely to keep the quid firmly in the spotlight and could set the tone for Cable’s next move.

Gold battle around $5,000 continues

Gold is giving back part of Friday’s sharp rebound, deflating below the key $5,000 mark per troy ounce as the new week gets underway. Modest gains in the US Dollar are keeping the metal in check, while thin trading conditions, due to the Presidents Day holiday in the US, are adding to the choppy and hesitant tone across markets.

Bitcoin consolidates as on-chain data show mixed signals

Bitcoin price has consolidated between $65,700 and $72,000 over the past nine days, with no clear directional bias. US-listed spot ETFs recorded a $359.91 million weekly outflow, marking the fourth consecutive week of withdrawals.

The week ahead: Key inflation readings and why the AI trade could be overdone

It is likely to be a quiet start to the week, with US markets closed on Monday for Presidents Day. European markets are higher across the board and gold is clinging to the $5,000 level after the tamer than expected CPI report in the US reduced haven flows to precious metals.

XRP steadies in narrow range as fund inflows, futures interest rise

Ripple is trading in a narrow range between $1.45 (immediate support) and $1.50 (resistance) at the time of writing on Monday. The remittance token extended its recovery last week, peaking at $1.67 on Sunday from the weekly open at $1.43.