|

Nvidia (NVDA) makes rally after three waves pull back

In this technical article we’re going to take a look at the Elliott Wave charts of Nvidia (NVDA) ,  presented in members area of the of our website.  Recently has given us 3 waves pull back as we were expecting. In the further text we are going to explain the Elliott Wave pattern and Forecast.

NVDA 1 hour Elliott Wave analysis 07.06.2023

Chart

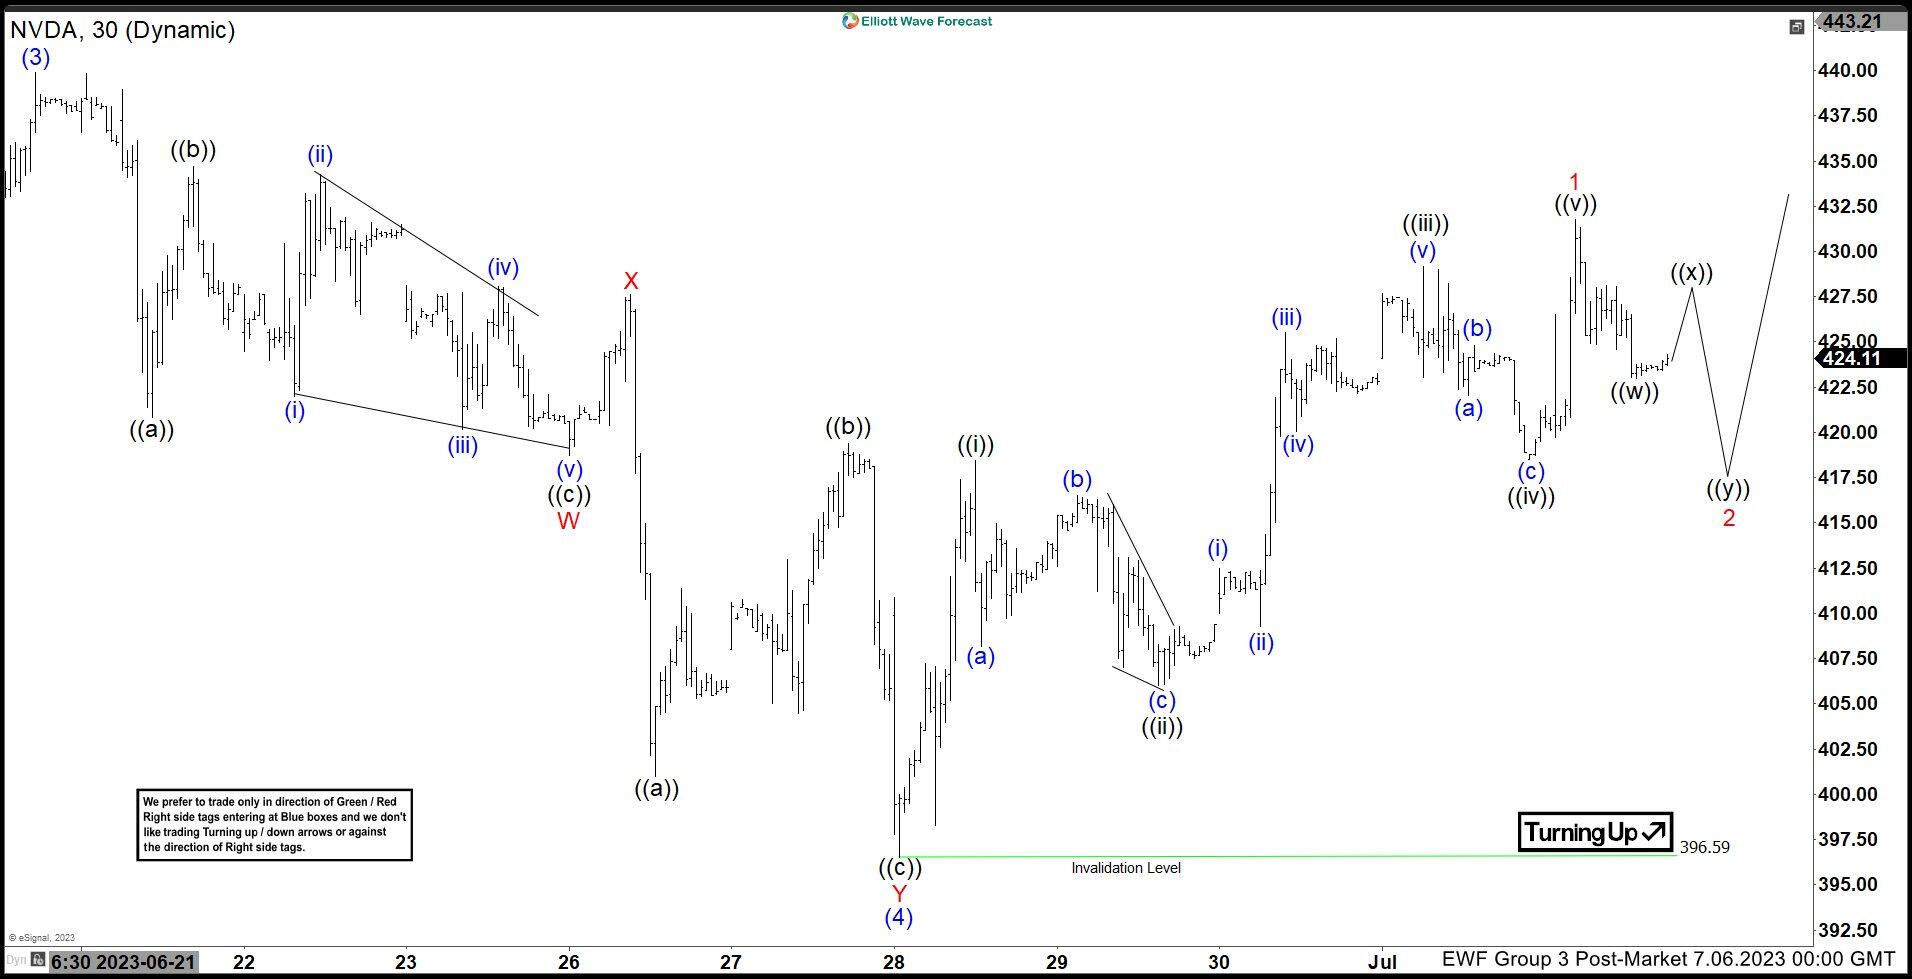
NVDA ended cycle from the 396.59 low as 5 waves pattern. Current view suggests we are getting 3 waves pull back in 2 red correction. At the moment the price is  ending first leg ((w)) of 2. We expect to see 3 waves bounce in ((x)) connector before final leg down ((y)) of 2 takes place.  At this stage we still cannot use equal legs ((w))-((x)) as target because ((x)) connector is not formed yet. So, we will us 50-61.8 fib retracement zone for a potential target of 2 red pull back. That area comes at 414.12-409.9.

NVDA 1 hour Elliott Wave analysis 07.09.2023

NDVA

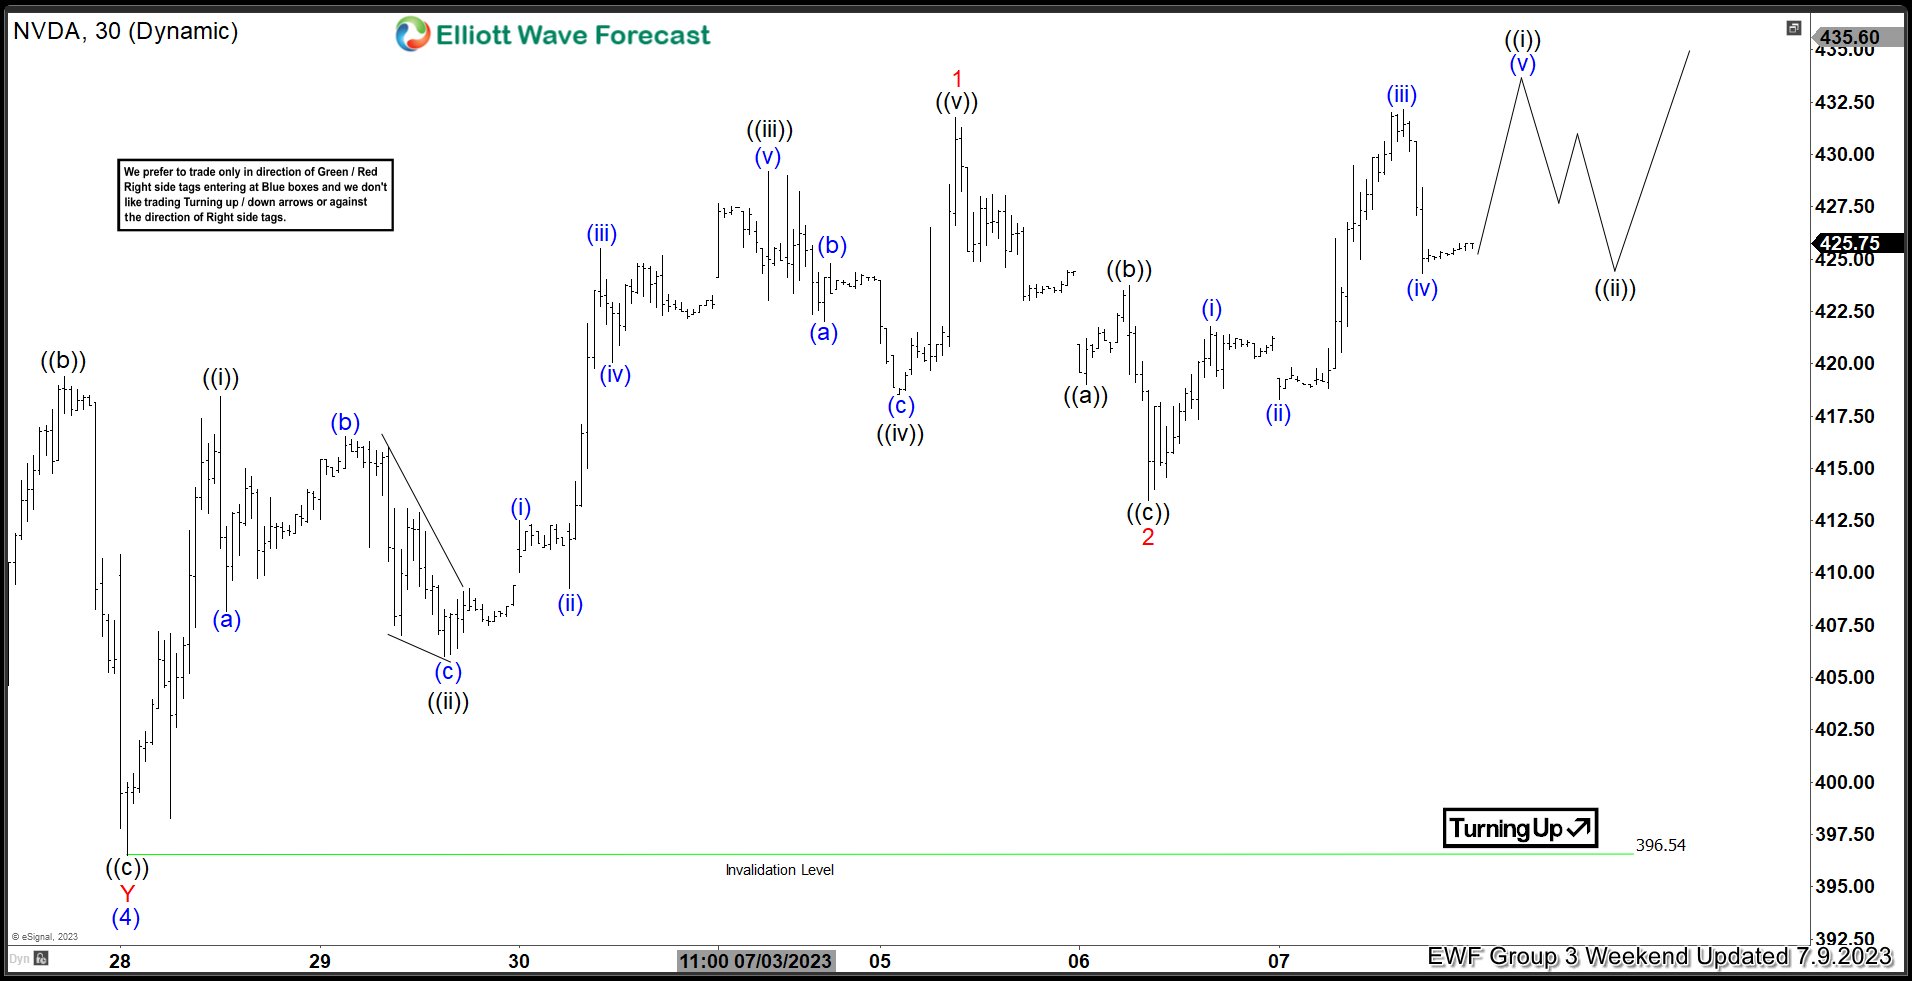
Eventually the stock made 3 waves in wave 2 red correction. The stock reached our target zone, 50-61.8 fibs against the 396.5 low and completed there. Now as far as the price stays above 413.4 low, we can count wave 2 red completed and expect further extension up ideally. We would like to see break above June 20th high to confirm further strength in the stock. Once we get proposed break up, we can look to buy the stock again in 3,7,11 swings.

Keep in mind that market is dynamic and presented view could have changed in the mean time.

Premium

You have reached your limit of 3 free articles for this month.

Start your subscription and get access to all our original articles.

Subscribe to PremiumSign In

Author

Elliott Wave Forecast Team

Elliott Wave Forecast Team

ElliottWave-Forecast.com

More from Elliott Wave Forecast Team
Share:

Markets move fast. We move first.

Orange Juice Newsletter brings you expert driven insights - not headlines. Every day on your inbox.

By subscribing you agree to our Terms and conditions.

Editor's Picks

EUR/USD posts modest gains above 1.1700 as ECB signals pause

The EUR/USD pair posts modest gains around 1.1710 during the early Asian session on Monday. The Euro strengthens against the Greenback after the European Central Bank left its policy rates unchanged and took a more positive view on the Eurozone economy, which has shown resilience to global trade shocks. Financial markets are likely to remain subdued as traders book profits ahead of the long holiday period.

GBP/USD gains ground near 1.3400 ahead of UK Q3 GDP data

GBP/USD gains ground after three days of losses, trading around 1.3390 during the Asian hours on Monday. The pair depreciates as the Pound Sterling holds ground ahead of the release of the United Kingdom Gross Domestic Product for the third quarter.

Gold refreshes record highs, eyes $4,400 amid renewed geopolitical tensions

Gold is closing in on $4,400 early Monday, renewing lifetime highs, helped by renewed geopolitical tensions. Israel-Iran conflict and US-Venezuela headlines drive investors toward the traditional store of value, Gold. 

Week ahead: Key risks to watch in last days of 2025 and early 2026

The festive period officially starts next week, with many traders vacating their desks until the first full week of January, making way for thin trading volumes and very few top-tier releases.

De-dollarisation by design: Gold’s partner in the new system

You don’t need another 2008 for the system to reset. You just need enough nations to stop settling trade in dollars. And that’s already happening. "If gold is the anchor, what actually moves value in a post-dollar world?” It’s a question most gold investors overlook. We think in terms of storage and preservation, but in the new rails being built, settlement speed matters just as much as soundness of money.

XRP rebounds amid ETF inflows and declining retail demand demand

XRP rebounds as bulls target a short-term breakout above $2.00 on Friday. XRP ETFs record the highest inflow since December 8, signaling growing institutional appetite.