NVIDIA Corporation (NVDA) Stock Price and Forecast: When does Nvidia report earnings?
- NVDA reports earnings after the close on Wednesday.
- NVDA stock is set to report EPS of $1.11 and revenue of $6.83 billion.
- NVIDIA is still trying to buy ARM, but UK regulators are examining the deal.

Nvidia (NVDA) stock had a fairly quiet session on Tuesday as investors digested news of the UK regulator taking a closer look at the proposed $50 billion merger with ARM. Investors also likely sat out taking too many bets ahead of earnings from Nvidia. Nvidia reports earnings after the close today.
-637727496884406143.png)
NVDA stock chart 15-minute
Nvidia (NVDA) stock news
The UK decided to do an in-depth investigation into Nvidia's proposed purchase of ARM. The UK Competition & Market Authority (CMA) had earlier raised concerns about the deal. ARM is a UK chip manufacturer, and the UK is concerned over the strategic importance of the deal. Nvidia will likely face more questions when it reports earnings after the close on Wednesday.
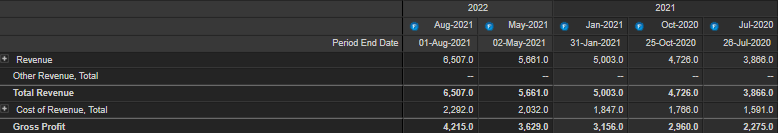
Nvidia is expected to report earnings per share (EPS) of $1.11 that compares to a year ago EPS of $0.73. Revenue is expected to reach $6.83 billion versus $4.73 billion a year ago. The company has beaten earnings on the bottom line going back for the last eight quarters, according to data from Refinitiv. The last earnings report on August 18 saw a spike in Nvidia's share price by 4%, while a quarter earlier earnings caused a 1% loss, which was followed by a 5% gain the next session. Semiconductors have been constantly in the news this year as global shortages hit manufacturers. Semiconductor stocks have been repeatedly strong throughout 2021.
Revenue and profits have been growing strongly as the table from Refinitiv shows. Investors will look for growth to continue and the speed of revenue growth to be maintained. Revenue has been growing at over 60% yearly, while EPS growth is running at nearly 45% annually. Net income has nearly quadrupled since July 2020. Now all this high growth comes at a cost, and that cost is a very high valuation. Nvidia has a price/earnings (P/E) ratio of over 90 when the Nasdaq has an average P/E of about 29. Even compared to peers, this one looks a bit high. Intel has a P/E of 10, AMD 47, Qualcomm 23. Nvidia's P/E is trading close to the top of its historical range. High P/Es need high growth to justify them, so any slowdown in growth will be punished.
Nvidia (NVDA) stock forecast
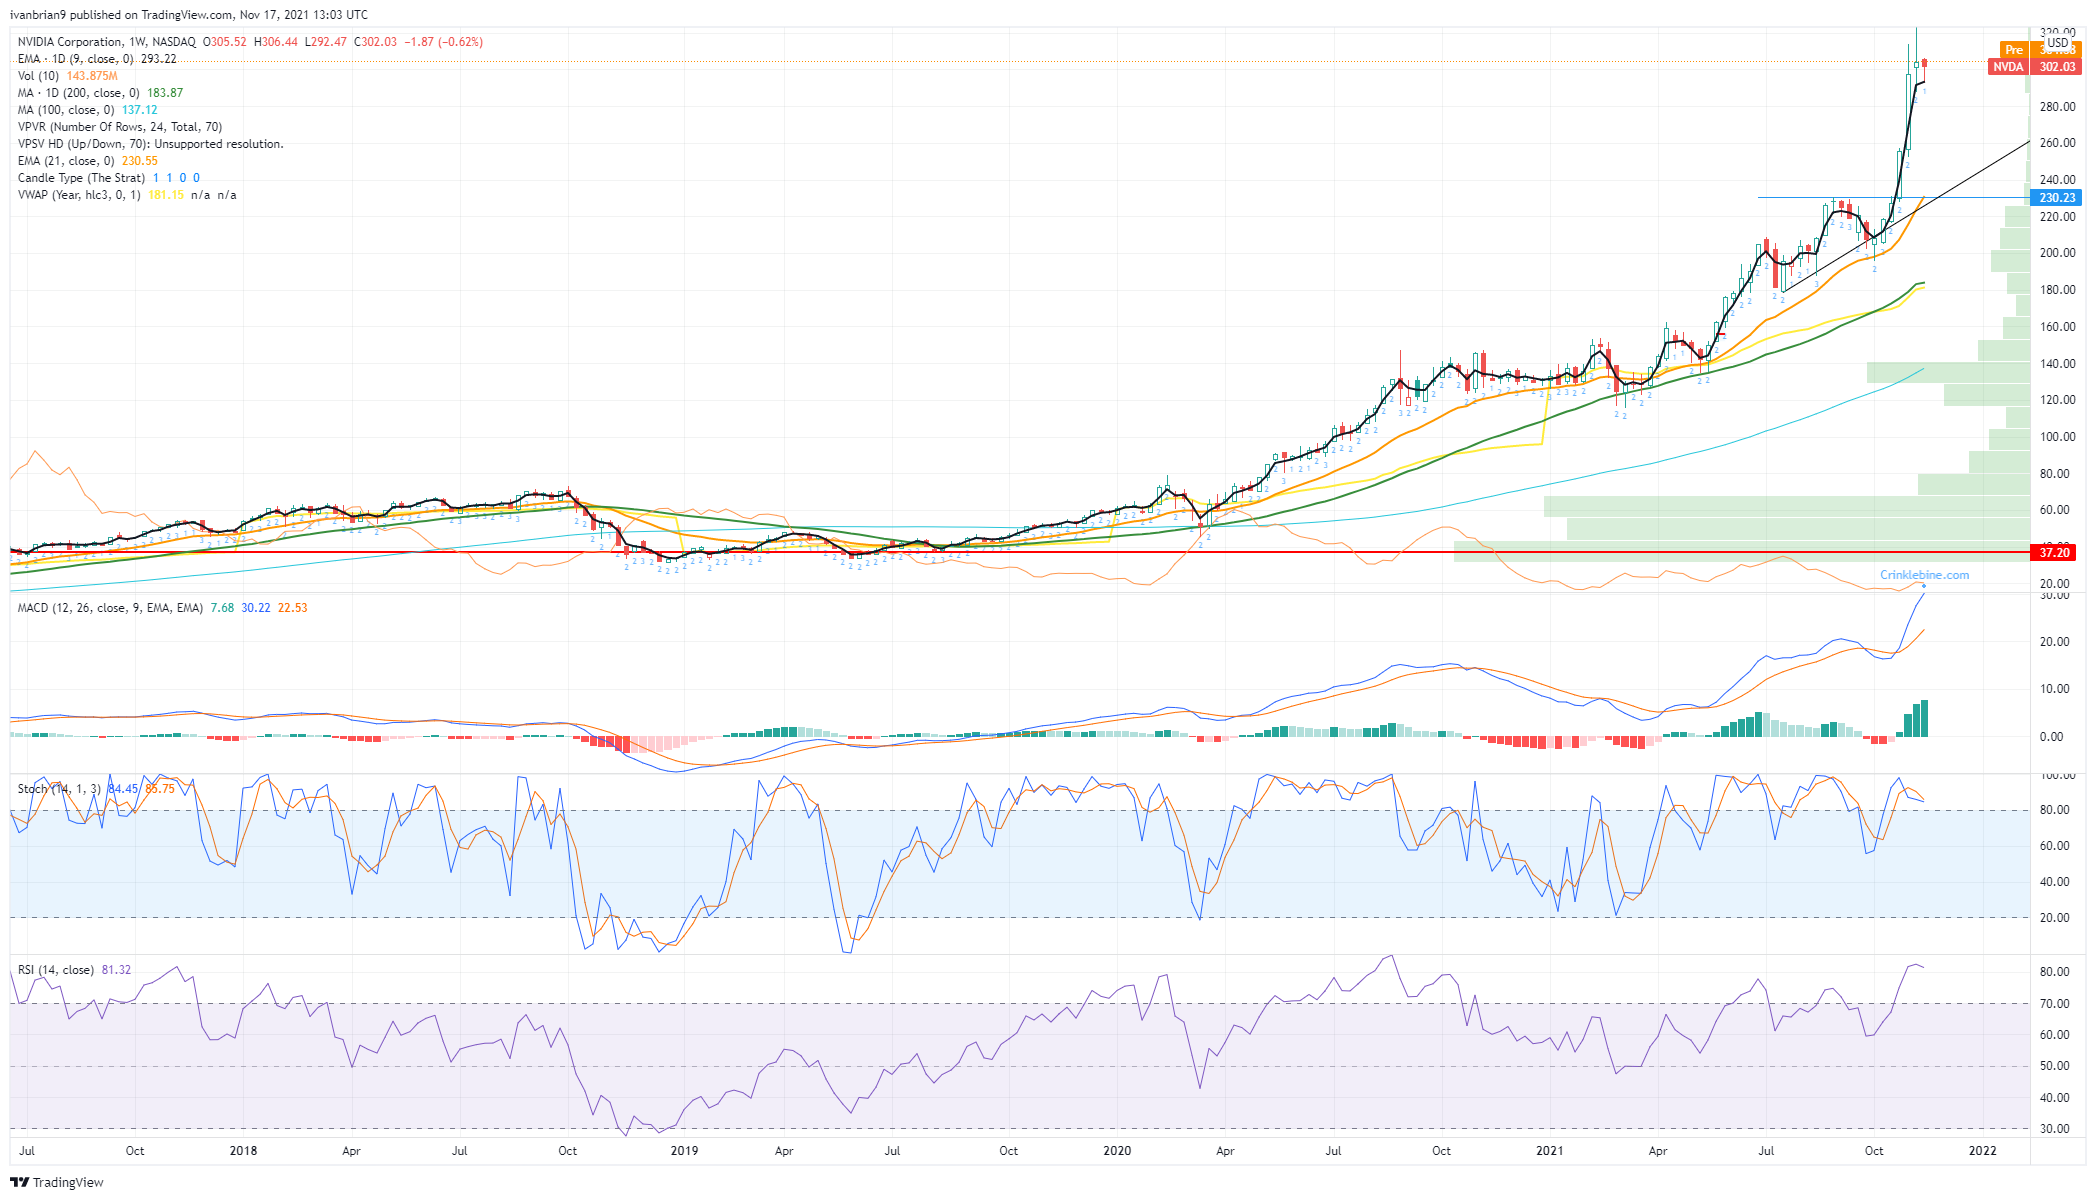
The weekly chart shows us where Nvidia stock might retrace to if a slowdown does occur. The last price explosion point is $230.23.
The daily chart shows us that this $230 level might not be so far away as thought. There is a huge volume vacuum once through $295, meaning an acceleration in losses would be probable. $230 to $200 becomes a strong support zone in that event. The 200-day will likely have edged up toward $200 also. Currently, NVDA stock has entered a consolidation phase after record highs. Usually this is a continuation phase, but the fall from highs can also be seen as an inverse flag, a bearish formation. The risk reward appears to be skewed to the downside in our view. This has had an increadible run, and exceptionally strong earnings are required to keep the move going.
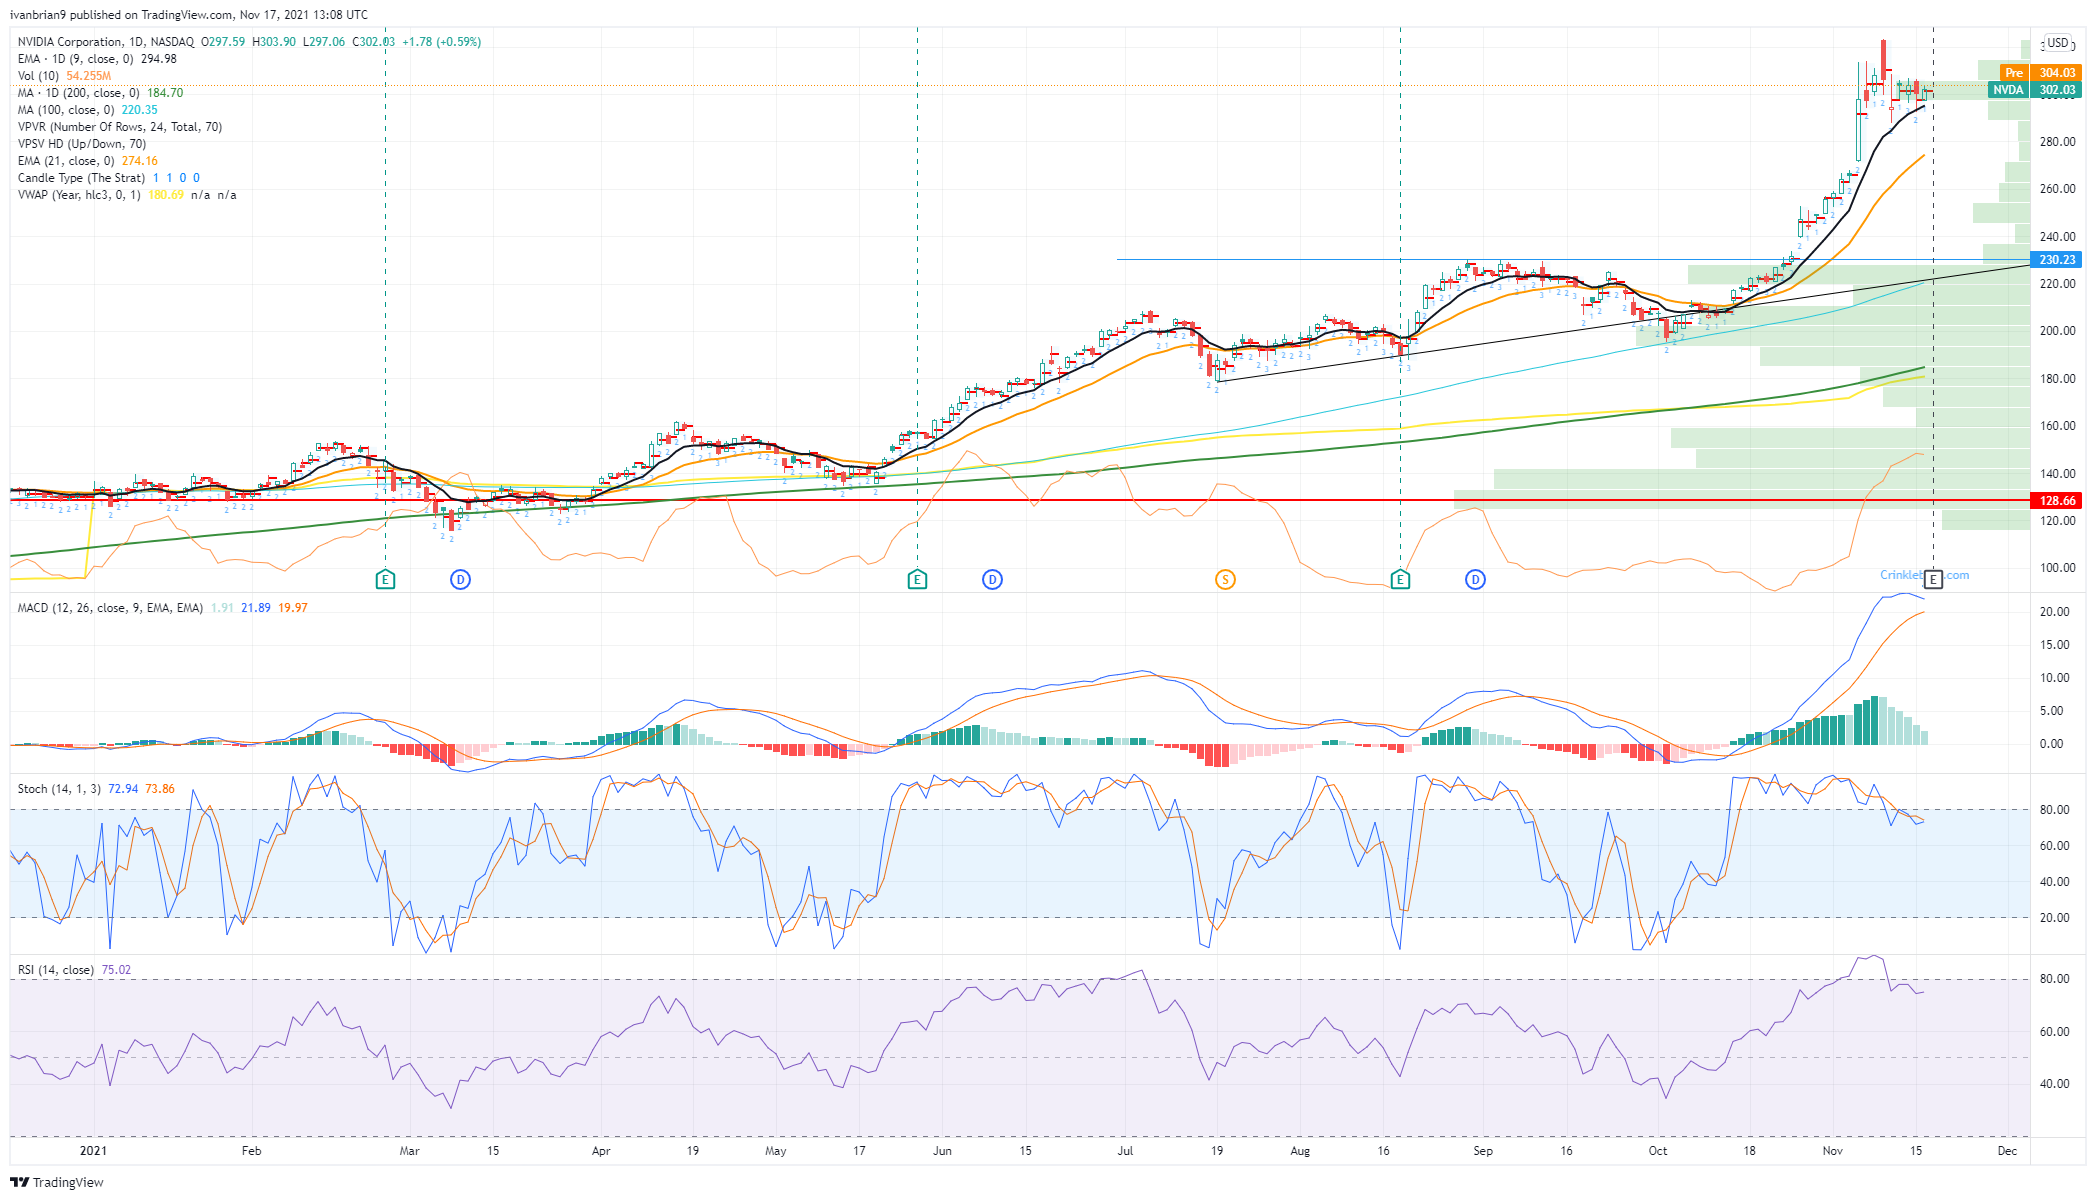
NVDA 1-day chart
Premium
You have reached your limit of 3 free articles for this month.
Start your subscription and get access to all our original articles.
Author

Ivan Brian
FXStreet
Ivan Brian started his career with AIB Bank in corporate finance and then worked for seven years at Baxter. He started as a macro analyst before becoming Head of Research and then CFO.


