Silver Price Forecast: XAG/USD breaks below 200-day SMA, eyes on YTD low
- Silver breaks below 200-day SMA, confirming bearish technical breakdown.
- RSI nears oversold territory, but downtrend remains firmly intact.
- Break below $61.02 exposes $60.00 and $54.46 supports.
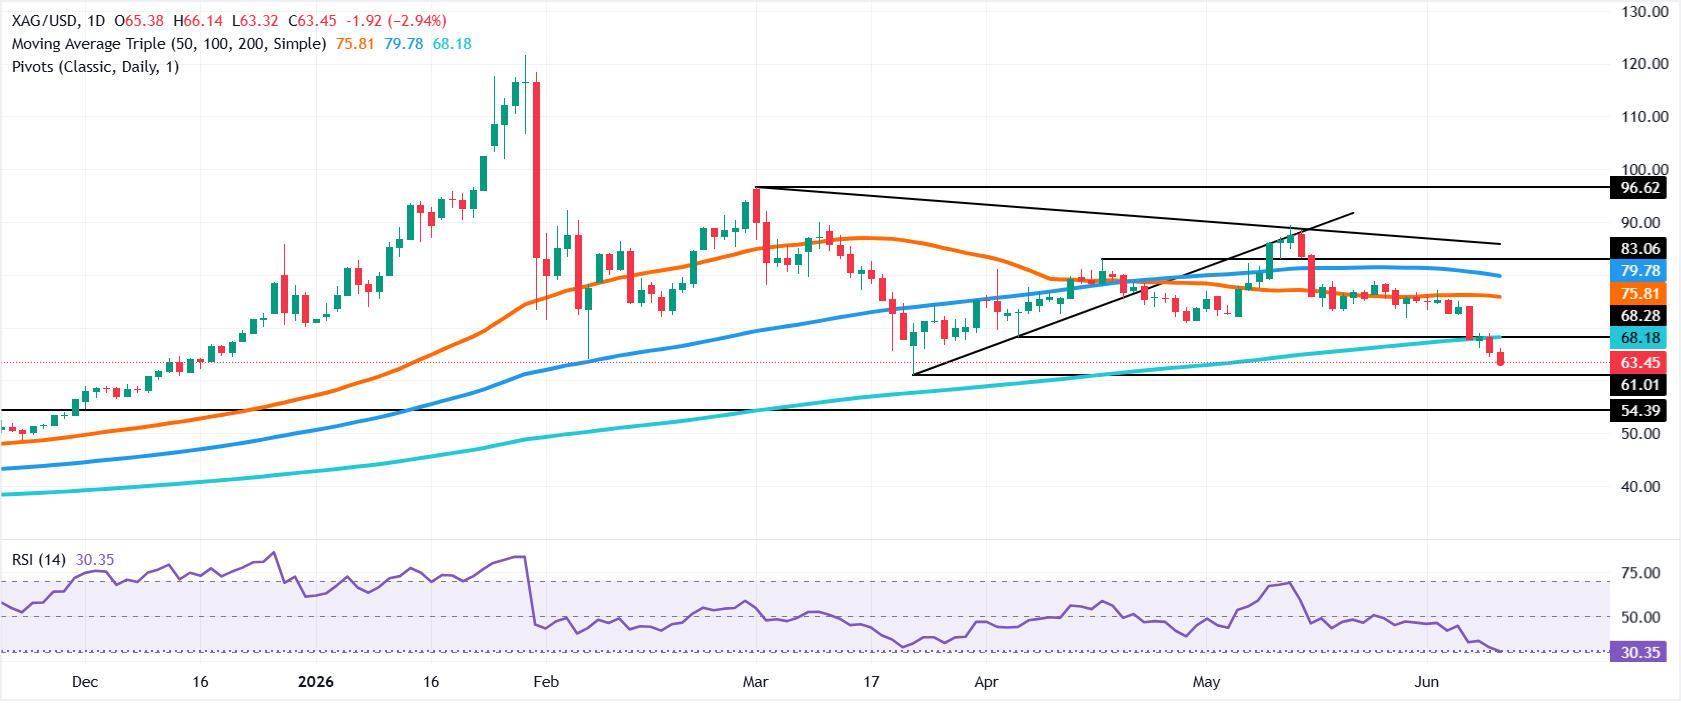
Silver price drops below $65.00, extending its week-long losses to more than 6%, trading down nearly 2.50% in the day as the white metal breaks below the 200-day Simple Moving Average (SMA) at $67.25.
XAG/USD Price Forecast: Technical Outlook
Price action suggests the white metal is poised to extend its losses if Silver dips below its year-to-date (YTD) low of $61.02 per troy ounce. Two days ago, XAG/USD fell below the 200-day SMA to a two-month low of $64.37, before hitting a new low of $63.37 at the time of writing.
Momentum is also extremely bearish as depicted in the Relative Strength Index (RSI). The index is near the 30% oversold territory, though given the strength of the downtrend, the most extreme level is at 20%. Hence, the path of least resistance is downwards.
Silver’s first support level is at $63.00. Below this level lies the YTD low of $61.02, ahead of the $60.00 mark. If hurdled, the next support is the October 17, 2025, daily high turned support at $54.46.
On the upside, Silver buyers must reclaim the $65.00 milestone before the 200-day SMA at $67.25.
XAG/USD Price Chart – Daily
Silver FAQs
Silver is a precious metal highly traded among investors. It has been historically used as a store of value and a medium of exchange. Although less popular than Gold, traders may turn to Silver to diversify their investment portfolio, for its intrinsic value or as a potential hedge during high-inflation periods. Investors can buy physical Silver, in coins or in bars, or trade it through vehicles such as Exchange Traded Funds, which track its price on international markets.
Silver prices can move due to a wide range of factors. Geopolitical instability or fears of a deep recession can make Silver price escalate due to its safe-haven status, although to a lesser extent than Gold's. As a yieldless asset, Silver tends to rise with lower interest rates. Its moves also depend on how the US Dollar (USD) behaves as the asset is priced in dollars (XAG/USD). A strong Dollar tends to keep the price of Silver at bay, whereas a weaker Dollar is likely to propel prices up. Other factors such as investment demand, mining supply – Silver is much more abundant than Gold – and recycling rates can also affect prices.
Silver is widely used in industry, particularly in sectors such as electronics or solar energy, as it has one of the highest electric conductivity of all metals – more than Copper and Gold. A surge in demand can increase prices, while a decline tends to lower them. Dynamics in the US, Chinese and Indian economies can also contribute to price swings: for the US and particularly China, their big industrial sectors use Silver in various processes; in India, consumers’ demand for the precious metal for jewellery also plays a key role in setting prices.
Silver prices tend to follow Gold's moves. When Gold prices rise, Silver typically follows suit, as their status as safe-haven assets is similar. The Gold/Silver ratio, which shows the number of ounces of Silver needed to equal the value of one ounce of Gold, may help to determine the relative valuation between both metals. Some investors may consider a high ratio as an indicator that Silver is undervalued, or Gold is overvalued. On the contrary, a low ratio might suggest that Gold is undervalued relative to Silver.
Author

Christian Borjon Valencia
FXStreet
Markets analyst, news editor, and trading instructor with over 14 years of experience across FX, commodities, US equity indices, and global macro markets.


