|

NextEra Energy (NEE) favors sideways lower before rally resumes

NextEra Energy Inc (NEE) generates, transmits, distributes & sells electric power to retail & wholesale customers in North America. The company generates electricity through wind, solar, coal, nuclear & natural gas. It is based in Juno Beach, Florida, comes under Utility sector & trades as “NEE” ticker at NYSE.

NEE made an all time high of $93.73 as impulse sequence as ((I)) & favors lower in ((II)) as double correction. It expects to remain sideways to lower & find the next support between $64.80 – $48.38 area before rally resumes.

NEE – Elliott Wave weekly latest view

Chart

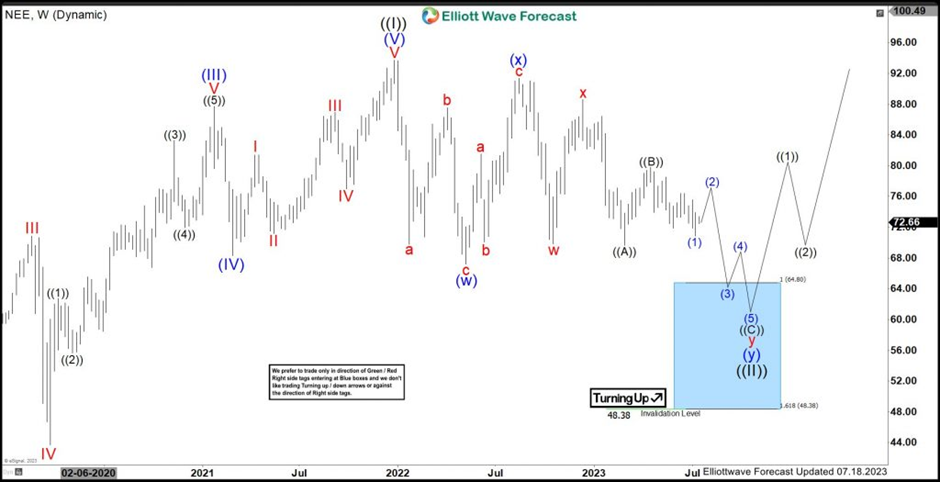
In weekly impulse sequence higher, it placed (III) at $87.69 high & (IV) at $68.33 low. Above there, it finished (V) as diagonal at $93.73 high as ((I)) in December-2021. Below there, it favors pullback in double correction in ((II)). It placed (w) at $67.22 low in 3 swing pullbacks. In (w), it ended a at $69.79 low, b at $87.52 high & c at $67.22 low. It bounced off in (x), ended at $91.35 high. In (x) connector, it placed a at $81.49 high, b at $75.77 low & c at $91.35 high as 3 swing sequence.

Below (x) high, it placed w of (y) at $69.81 low & x at $88.61 high. It favors lower in y of (y) in 3 swing sequence & expect to remain sideways to lower. It favors lower in ((C)) of y of (y), while bounce fail below ((B)) high of $79.78, which confirms below ((A)) low of $69.64 and extend towards $64.80 – $48.38 area to finish ((II)) correction. We like to buy from the blue box area for next sequence higher or at least 3 swing reaction higher. Alternatively, if it breaks above $79.78 high, it can either extend ((B)) leg before turning lower or can be x connector, while placed w at last low in (y) leg.

Author

Elliott Wave Forecast Team

Elliott Wave Forecast Team

ElliottWave-Forecast.com

More from Elliott Wave Forecast Team
Share:

Editor's Picks

EUR/USD looks weak below 1.1800

EUR/USD has slipped back under pressure, breaking through the 1.1800 support and drifting towards the weekly lows near 1.1770 ahead of the opening bell in Asia. The move reflects renewed strength in the US Dollar, with steady geopolitical tensions keeping its demand firm. Moving forward, the release of the German labour market report and flash inflation figures should keep European investors entertained on Friday.
 

GBP/USD threatens the 200-day SMA near 1.3440

GBP/USD rapidly leaves behind Wednesday’s strong advance, coming under heavy pressure and retesting the 1.3440 zone, where the critical 200-day SMA is located. Cable’s deep pullback follows the strong gains in the Greenback, while investors continue to pencil in a potential BoE rate cut in March.

Gold remains below $5,200 despite tariff jitters and geopolitical risks

Gold is seen consolidating in a range below the $5,200 mark during the Asian session on Friday amid mixed cues. Trade jitters, along with the risk of a potential US-Iran war, act as a tailwind for the safe-haven bullion. Meanwhile, the Fed's hawkish outlook keeps the US Dollar close to the monthly high and caps the non-yielding yellow metal. Nevertheless, the commodity remains on track to register gains for the fourth straight week, though the fundamental backdrop warrants some caution for bullish traders.

How AI, blockchain, stablecoins are shaping a new global economy – Circle CEO Jeremy Allaire

Artificial Intelligence (AI), blockchain technology and stablecoins are emerging as core pillars of a new global economic system, according to Circle’s CEO, Jeremy Allaire.

Changing the game: International implications of recent tariff developments

The Supreme Court ruling on International Emergency Economic Powers Act (IEEPA) tariffs provides limited relief for the rest of the world, with weighted average tariff rates modestly lower.

Bitcoin steadies as traders eye US–Iran talks

Bitcoin (BTC) price is stabilizing around $68,000 at the time of writing on Thursday after a 6.2% relief rally the previous day amid a broader downward trend.