ASX: Newmont Corporation – NEM Elliott Wave technical analysis
Today’s Elliott Wave analysis focuses on NEWMONT CORPORATION – NEM, listed on the ASX.
Our forecast identifies that ASX:NEM is trending upward within wave three. This detailed breakdown highlights critical targets and an invalidation level, helping you recognize when the current trend may reverse or continue holding bullish momentum.
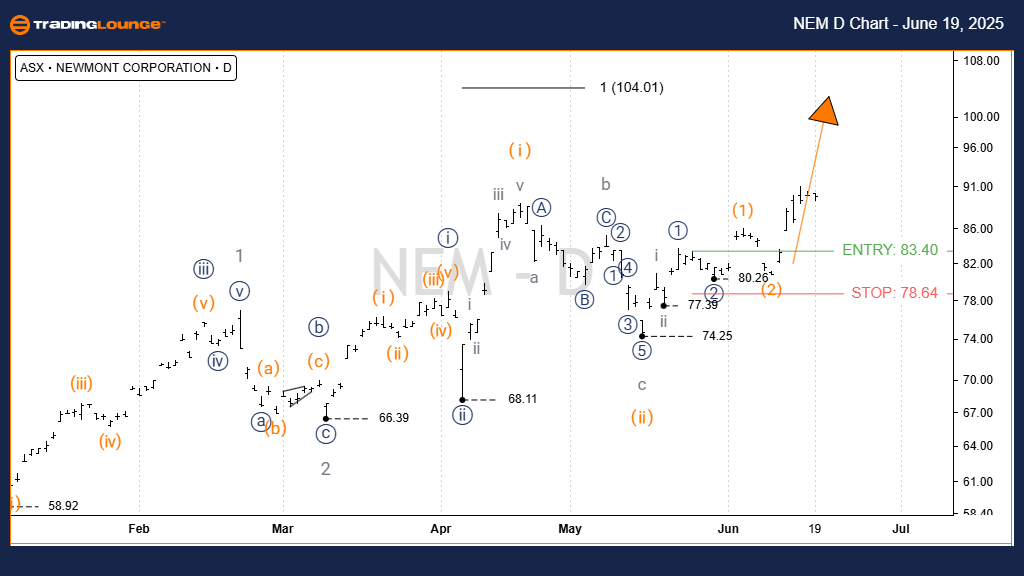
One-day chart (semilog scale)
-
Function: Major trend (Minor degree, grey).
-
Mode: Motive.
-
Structure: Impulse.
-
Position: Wave iii) - orange of Wave iii)) - navy of Wave 3 - grey.
Details:
Wave ii) - orange appears to have ended at the 74.25 low, forming a zigzag a-b-c pattern (grey). From that point, wave iii) - orange is advancing, with an upside target projected near 100.00.
- Invalidation point: 74.25.
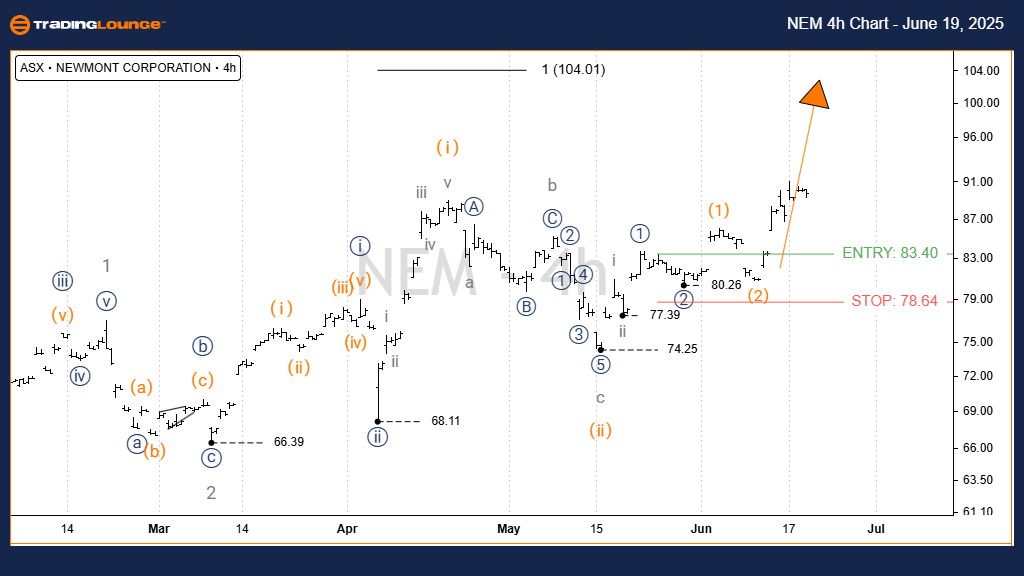
ASX: Newmont Corporation - NEM – Four-hour chart
-
Function: Major trend (Minor degree, grey).
-
Mode: Motive.
-
Structure: Impulse.
-
Position: Wave iii) - orange of Wave ((iii)) - navy of Wave 3 - grey.
Details:
The short-term chart confirms the continuation of the bullish pattern shown in the daily chart. Wave iii) - orange is targeting the 100.00 mark, with an interim objective near 90.00 as wave iii - grey progresses higher.
- Invalidation point: 74.25.
Conclusion
This analysis of NEWMONT CORPORATION – NEM on the ASX offers a detailed outlook on current and short-term market behavior. Using Elliott Wave principles, we present clear price levels to validate or invalidate the current wave count, helping improve strategic confidence. Our aim is to deliver a neutral, data-driven interpretation of the market trend.
Newmont Corporation – NEM Elliott Wave technical forecast [Video]
As with any investment opportunity there is a risk of making losses on investments that Trading Lounge expresses opinions on.
Historical results are no guarantee of future returns. Some investments are inherently riskier than others. At worst, you could lose your entire investment. TradingLounge™ uses a range of technical analysis tools, software and basic fundamental analysis as well as economic forecasts aimed at minimizing the potential for loss.
The advice we provide through our TradingLounge™ websites and our TradingLounge™ Membership has been prepared without considering your objectives, financial situation or needs. Reliance on such advice, information or data is at your own risk. The decision to trade and the method of trading is for you alone to decide. This information is of a general nature only, so you should, before acting upon any of the information or advice provided by us, consider the appropriateness of the advice considering your own objectives, financial situation or needs. Therefore, you should consult your financial advisor or accountant to determine whether trading in securities and derivatives products is appropriate for you considering your financial circumstances.
Recommended content
Editors’ Picks

AUD/USD: Door open to extra losses
AUD/USD remained on the back foot on Tuesday, down for the third day in a row and retreating to five-day lows near the key 0.6500 support, always amid the resurgence of the strong demand for the US Dollar, this time underpinned by higher US inflation readings in June.

EUR/USD: Further weakness could extend to 1.1460
On Tuesday, the EUR/USD resumed its negative trend by falling below the crucial support at 1.1600 the figure and reaching fresh three-week lows against the background of a stronger Greenback. So far in July, the pair has only closed higher on two occasions.

Gold's selling pressure picks up pace, focus on $3,320
Gold prices now lose the grip and prompt the precious metal to retreat to daily troughs near the $3,320 mark per troy ounce. The increasing selling pressure around the yellow metal comes in response to a stronger US Dollar, rising US yields across the curcve, and the idea that the Fed might remain cautious for longer.

Ripple Prediction: XRP eyes breakout past $3.00 amid 'Crypto Week'
Ripple (XRP) drops below $3.00 on Tuesday, exchanging hands at $2.87 during the American session. The volatility follows XRP's rally, which tagged a weekly high of $3.03 the previous day, reflecting investors' desire to de-risk in the broader cryptocurrency market.

China’s first-half growth remains on track, though activity data signals caution
China's second-quarter GDP beat forecasts again with a 5.2% year-on-year growth, driven by strong trade and industrial production. Yet sharper-than-expected slowdowns in fixed-asset investment and retail sales and falling property prices are a concern.

Best Brokers for EUR/USD Trading
SPONSORED Discover the top brokers for trading EUR/USD in 2025. Our list features brokers with competitive spreads, fast execution, and powerful platforms. Whether you're a beginner or an expert, find the right partner to navigate the dynamic Forex market.