NBCC eyes 89.69–77.24 before rally above 137.56

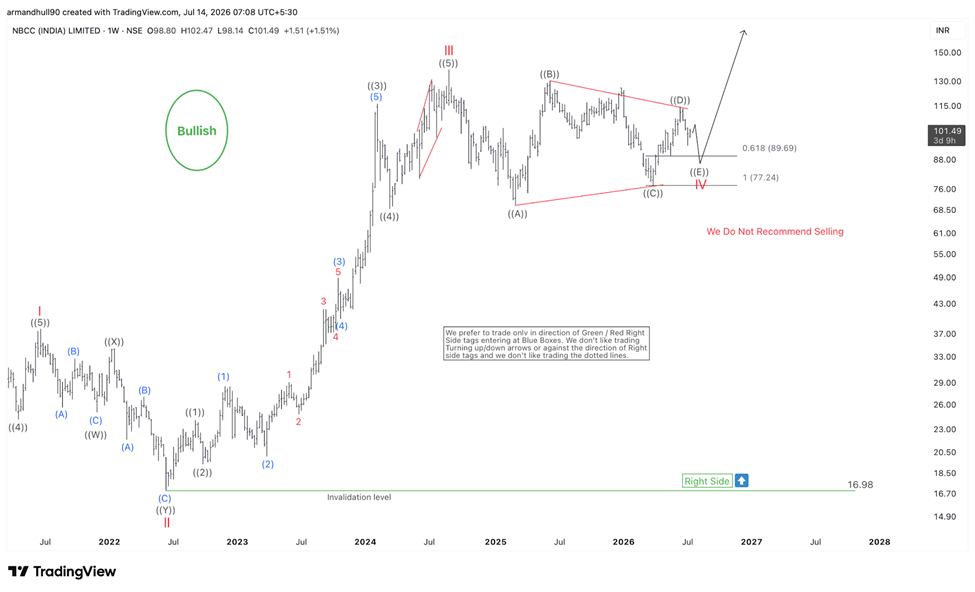
Wave IV is unfolding in its final triangle leg as NBCC approaches a key support zone. The current decline in wave ((E)) is expected to end between 89.69 and 77.24 before the long-term bullish trend resumes above 137.56.
NBCC (India) Limited continues to maintain a constructive long-term Elliott Wave structure despite the ongoing correction from its 2024 peak. After delivering an exceptional rally from the 2022 low, the stock completed a five-wave impulsive advance into wave III at 137.56. Since then, price has entered a corrective phase that appears to be unfolding exactly as expected within a classic Elliott Wave triangle pattern. The broader trend remains firmly bullish, and the current decline should be viewed as a corrective pause rather than the beginning of a larger bearish trend. As long as the long-term invalidation level at 16.98 remains intact, we continue to favor higher prices once the correction is complete.
Wave IV triangle enters its final stage
The correction consists of five internal legs labeled wave ((A)), ((B)), ((C)), ((D)), and ((E)). According to the current structure, wave ((D)) has already completed, and NBCC has started the final decline in wave ((E)). This last leg should unfold in a corrective three-swing sequence while remaining above the low of wave ((C)), preserving the validity of the triangle. Based on Fibonacci projections, we expect wave IV to complete within the 89.69–77.24 support zone. This area represents a high-probability region where buyers could return and prepare the stock for the next impulsive advance.
Wave V outlook remains bullish
Once wave IV completes, NBCC should begin wave V, resuming the larger bullish trend. The first objective will be a break above the previous wave III high at 137.56, which represents roughly 40% upside from current levels. A move above that level would confirm the continuation of the long-term impulsive sequence, with the potential for additional gains if wave V extends. Until the correction finishes, traders should continue monitoring the 89.69–77.24 region for signs of a completed Elliott Wave structure. A completed three-swing decline followed by a bullish reversal would strengthen the case that wave IV has ended.
Summary
NBCC remains in a long-term bullish Elliott Wave trend despite its ongoing wave IV correction. The stock is currently developing the final wave ((E)) leg of a contracting triangle, with support expected between 89.69 and 77.24. Once the correction is complete, we expect wave V to break above 137.56, offering approximately 40% upside while keeping the broader bullish outlook intact.
Author

Elliott Wave Forecast Team
ElliottWave-Forecast.com