Natural Gas Price Analysis: XNG/USD trades above 23.6% Fibo., bullish potential intact
- Natural Gas price edges lower on Thursday, albeit lacks follow-through selling.
- The technical setup favours bulls and supports prospects for additional gains.
- A break below the overnight swing low is needed to negate the positive outlook.

Natural Gas price struggles to capitalize on the previous day's solid bounce from the weekly low and meets with some supply during the Asian session on Thursday. The XNG/USD currently trades around the $2.670 area, down over 0.10% for the day, though the technical setup favours bullish traders.
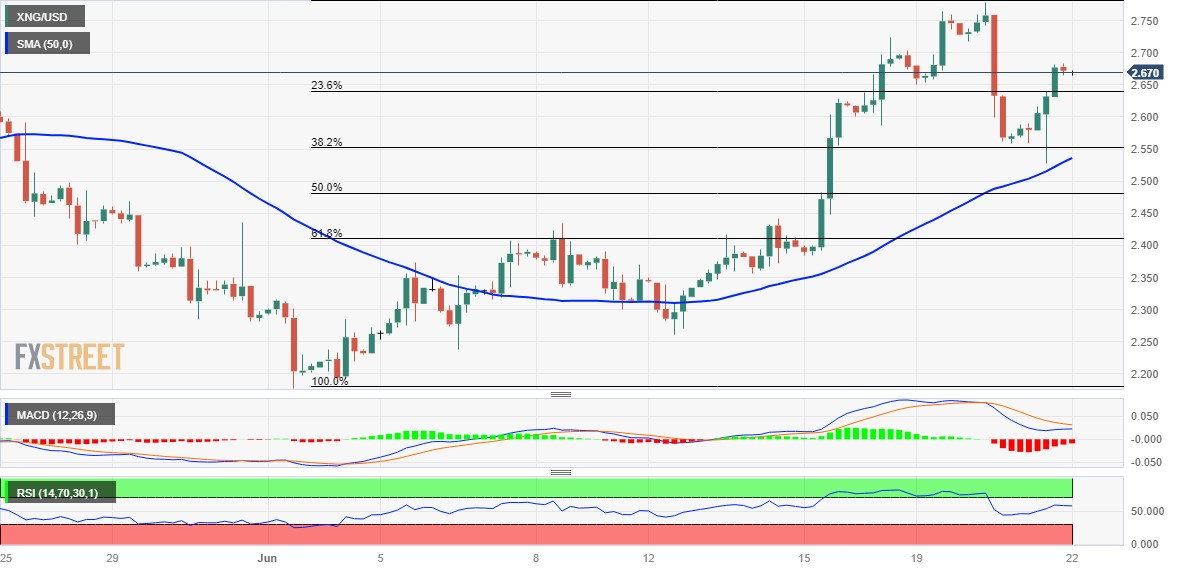
This week's pullback from a one-month high touched on Tuesday showed some resilience below the 38.2% Fibonacci retracement level of the rally witnessed since the beginning of this month. The subsequent rally back above the 23.6% Fibo. level adds credence to the positive outlook and supports prospects for a further near-term appreciating move. Hence, any subsequent slide might still be seen as a buying opportunity and is likely to remain limited.
The 23.6% Fibo. level, around the $2.65 region now seems to protect the immediate downside ahead of the $2.55 area, or the 38.2% Fibo. level. This is followed by the overnight low, just above the mid-$2.00s horizontal resistance breakpoint, which coincides with the 50-period Simple Moving Average (SMA) on the 4-hour chart and should act as a pivotal point. A convincing break below might prompt some technical selling and pave the way for deeper losses.
The XNG/USD might then accelerate the fall towards 61.8% Fibo. level, around the $2.40 region before eventually dropping to the $2.285-$2.275 area. The downward trajectory could get extended and expose the monthly low, around the $2.195-2.175 zone.
On the flip side, immediate resistance is pegged near the $2.755-$2.765 area ahead of the monthly top, around the $2.780 region. Some follow-through buying will be seen as a fresh trigger for bullish traders and lift the XNG/USD beyond an intermediate barrier near $2.915, towards reclaiming the $3.000 round figure. The momentum could get extended further and eventually lift Natural Gas price to the March swing high, around the $3.075-$3.080 zone.
XNG/USD 4-hour chart
Author

Haresh Menghani
FXStreet
Haresh Menghani is a detail-oriented professional with 10+ years of extensive experience in analysing the global financial markets.


