- Natural Gas price attracts some dip-buying on Thursday and reverses a part of the overnight slide.
- The technical setup still seems tilted in favour of bulls and supports prospects for additional gains.
- A break below the ascending channel/100-day SMA confluence should negate the positive outlook.
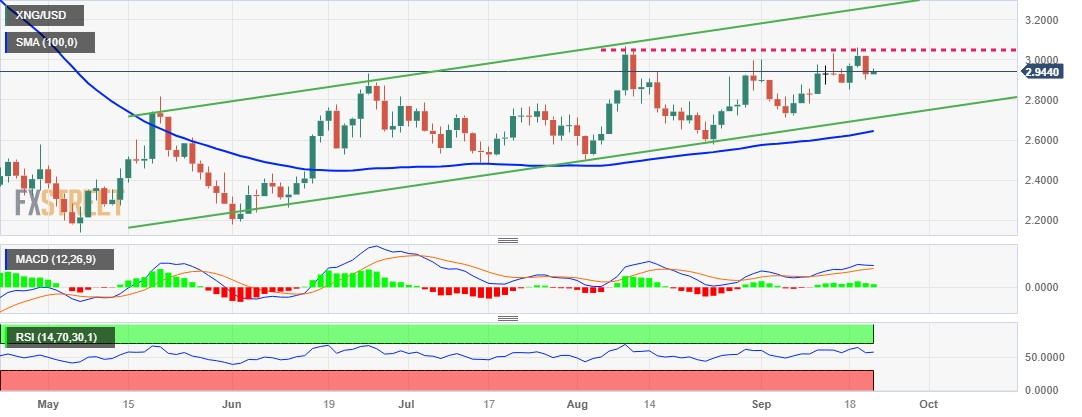
Natural Gas price edges higher during the Asian session on Thursday and reverses a part of the previous day's heavy losses, though the intraday uptick lacks bullish conviction. The XNG/USD currently trades around the $2.9430 region, up over 0.50% for the day, and for now, seems to have stalled this week's retracement slide from the vicinity of a multi-month top touched in August.
From a technical perspective, the recent move-up witnessed over the past four months or so has been along an upward-sloping channel, which points to a well-established short-term uptrend. The subsequent breakout through and acceptance above the very important 200-day Simple Moving Average (SMA) favours bullish traders. This, along with the fact that oscillators on the daily chart are holding comfortably in the positive territory and are still far from being in the overbought zone, suggests that the path of least resistance for the XNG/USD pair is to the upside.
That said, a bullish rejection near the $3.0620 level, ahead of the August swing high, warrants some caution before positioning for additional gains. The overnight trough, around the $2.9000 area, however, might now protect the immediate downside ahead of the $2.8850 region and the weekly low, around the $2.8520 zone. The latter coincides with the 200-day SMA, which if broken will expose the monthly trough, around the $2.7150 area. The XNG/USD could drop further to test the ascending channel support near the $2.700 area and the 100-day SMA around $2.6500.
Some follow-through selling below the latter will suggest that the recovery from the $2.1780 area, or a multi-year low touched in June has run its course and shift the near-term bias back in favour of bearish traders.
On the flip side, any subsequent intraday move-up is likely to confront stiff resistance ahead of the $3.0000 psychological mark. The next relevant hurdle is pegged near the $3.0200 area, above which the XNG/USD could climb to challenge the $3.0620-$3.0650 supply zone. A sustained strength beyond should pave the way for a move towards testing the top boundary of the aforementioned trend-channel, currently pegged around the $3.2550 region.
XNG/USD daily chart
Information on these pages contains forward-looking statements that involve risks and uncertainties. Markets and instruments profiled on this page are for informational purposes only and should not in any way come across as a recommendation to buy or sell in these assets. You should do your own thorough research before making any investment decisions. FXStreet does not in any way guarantee that this information is free from mistakes, errors, or material misstatements. It also does not guarantee that this information is of a timely nature. Investing in Open Markets involves a great deal of risk, including the loss of all or a portion of your investment, as well as emotional distress. All risks, losses and costs associated with investing, including total loss of principal, are your responsibility. The views and opinions expressed in this article are those of the authors and do not necessarily reflect the official policy or position of FXStreet nor its advertisers. The author will not be held responsible for information that is found at the end of links posted on this page.
If not otherwise explicitly mentioned in the body of the article, at the time of writing, the author has no position in any stock mentioned in this article and no business relationship with any company mentioned. The author has not received compensation for writing this article, other than from FXStreet.
FXStreet and the author do not provide personalized recommendations. The author makes no representations as to the accuracy, completeness, or suitability of this information. FXStreet and the author will not be liable for any errors, omissions or any losses, injuries or damages arising from this information and its display or use. Errors and omissions excepted.
The author and FXStreet are not registered investment advisors and nothing in this article is intended to be investment advice.
Recommended content
Editors’ Picks
EUR/USD bounces back, trades above 1.0860

EUR/USD bounced from a fresh weekly low of 1.0827, as the US Dollar lost steam following a weak ISM Manufacturing PMI report and words from Federal Reserve Chair Jerome Powell. Powell reiterated its hawkish message, dismissing potential rate cuts in the near future.
GBP/USD turns north ahead of the weekly close

GBP/USD recovered above 1.2650 in the American session on Friday. The US Dollar lost its temporal momentum and ends the weekly with a soft note amid soft local data. Hawkish comments from BoE officials underpinned the Pound this week.
Gold resumes advance and approaches record highs

Gold price (XAU/USD) quickly changed course after the US opening, trading above $2,050 a troy ounce. The US Dollar gave up intraday gains following the release of a worse.-than-anticipated IS Manufacturing PMI, indicating persistent weekends mid-Q4.
Solana likely to extend gains as DeFi airdrop season could boost user base

Solana ecosystem will see airdrops from projects like Jupiter, Marginfi, Drift, Zeta and Jito. Solana users are projected to increase between 30% and 80% from native token launches, according to Messari’s latest report. SOL price extends rally, yielding nearly 4% daily gains.
Weekly focus: Disinflation continues

This week, inflation came in below expectations in the euro area and the US. In the euro area, headline inflation fell much more than expected to 2.4% y/y (consensus: 2.7% y/y) in November from 2.9% in October.