|

Natural Gas Price Analysis: XNG/USD pares the biggest daily loss in a week near $2.66, bears keep control

  • Natural Gas Price rebounds from weekly low, snaps two-day losing streak with mild gains.
  • Clear rejection of 13-day-old bullish channel, looming bear cross on MACD and steady RSI keeps XNG/USD sellers hopeful.
  • Key Fibonacci retracement levels, 50-EMA lure Natural Gas bears.
  • XNG/USD bulls need validation from $2.78 to retake control.

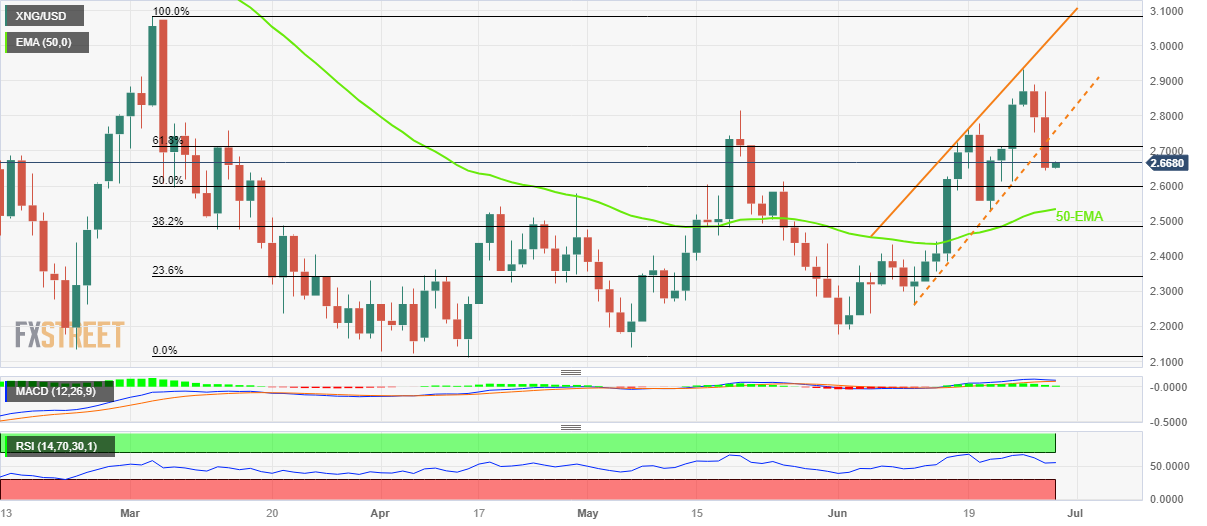
Natural Gas Price (XNG/USD) consolidates the weekly loss to around $2.66 in Thursday’s mid-Asian session, after declining heavily in the last two consecutive days.

That said, the XNG/USD’s downside break of the two-week-old bullish channel’s support allowed the energy bears to tighten their grips the previous day. Adding strength to the quote’s downside bias is its decline below the 61.8% Fibonacci retracement of the March-April downturn.

Furthermore, the impending bear cross on the MACD and steady RSI (14) line are some of the extra catalysts that suggest further downside of the Natural Gas Price.

Though, a 50% Fibonacci retracement level of $2.60 appears the immediate support to watch for the Natural Gas sellers. However, the 50-day Exponential Moving Average (EMA) surrounding $2.53 appears a tough nut to crack for the XNG/USD bears afterward.

On the contrary, the golden Fibonacci ratio, the 61.8% Fibonacci retracement level of $2.71, restricts the short-term recovery of the Natural Gas Price.

However, the XNG/USD bulls remain off the table unless witnessing a clear upside break of the stated channel’s lower line, near $2.76 by the press time.

In a case where the Natural Gas Price remains firmer past $2.76, the odds of witnessing a rally toward the $3.00 psychological magnet can’t be ruled out.

Natural Gas Price: Daily chart
Trend: Further weakness expected

Author

Anil Panchal

Anil Panchal

FXStreet

Anil Panchal has nearly 15 years of experience in tracking financial markets. With a keen interest in macroeconomics, Anil aptly tracks global news/updates and stays well-informed about the global financial moves and their implications.


More from Anil Panchal
Share:

Editor's Picks

AUD/USD remains depressed near 0.6950 after RBA minutes

AUD/USD attracts follow-through selling during Tuesday’s Asian session, looking to extend the overnight rejection slide from 0.7000, or a two-week top, following the release of RBA meeting Minutes. The US Dollar retains a bullish undertone near its highest level since April 2025 as energy-driven inflation risks keep December Fed rate hike bets firmly on the table. Adding to this, geopolitical risks further underpin the safe-haven USD.

USD/JPY extends retreat below 158.50 as intervention risks loom

USD/JPY is dropping below 158.50 in the Asian session on Tuesday, snapping a two-day winning streak and pulling back from an over two-week top touched the previous day, despite Japan's soft PPI inflation print. Bulls turn cautious amid speculation that authorities will step in to prop up the Japanese Yen, which, in turn, weighs on the pair.

Gold clings to gains just below $4,200

Gold fades Monday’s small pullback and picks up renewed pace, briefly flirting with the key $4,200 mark per troy ounce. The precious metal’s recovery comes in line with the fresh downward trend in the Greenback in combination with shrinking US Treasury yields across the board and easing tensions on the geopolitical front.

Bitcoin rebounds despite cautious sentiment

Bitcoin rebounds over 2%, trading above $83,500 on Tuesday, recovering the previous day’s losses. Persistent geopolitical tensions and mixed signals continue to weigh on risk appetite, keeping investors cautious despite BTC’s recovery.

US – Midterm update: Democratic lead holds three weeks before election

With three weeks until the US midterm election on 3 November, prediction markets are more or less unchanged. Polymarket continues to put the probability of a Democratic sweep at 60-65%. The House is seen as a fairly safe Democratic win, with a probability of around 90%.

Has Bitcoin really escaped the macro forces it was built to fight?
Over 17 years ago, Satoshi Nakamoto designed Bitcoin (BTC) on the back of a global financial crisis as an alternative to the global monetary system outside the control of central banks, governments and traditional intermediaries. This raises a key question: has Bitcoin really become independent of the macroeconomic forces it was built to challenge?















