Natural Gas Price Analysis: XNG/USD drops back below 100-EMA but stays bullish beyond $2.67
- Natural Gas Price remains depressed after reversing from three-month high and snapping four-day uptrend.
- Overbought RSI conditions, 100-EMA favored recent pullback in XNG/USD prices.
- Convergence of 10-EMA, fortnight-old rising trend line restricts immediate downside.
- Natural Gas sellers need validation from previous resistance line stretched from March to retake control.

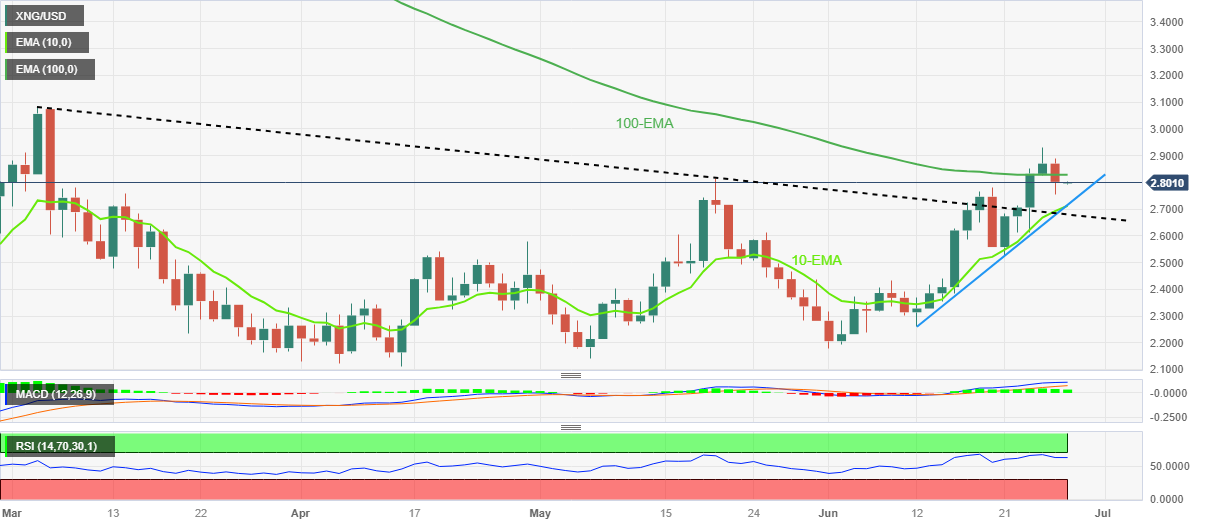
Natural Gas Price (XNG/USD) holds lower ground near $2.80 after printing the first daily loss in five, as well as reversing from the highest levels since March. Even so, the XNG/USD remains well above the short-term key support and keeps buyers hopeful amid the bullish MACD signals.
That said, the nearly overbought RSI (14) line joined the energy instrument’s failure to cross the 100-EMA to trigger the XNG/USD’s pullback the previous day.
The same joins the recent US dollar rebound directs the Natural Gas Price toward the $2.71 support confluence comprising a two-week-old ascending trend line and the 10-Exponential Moving Average (EMA).
However, the commodity’s further downside is likely to be challenged by the previous support line stretched from early March, around $2.67, which if broken won’t hesitate to direct the quote towards the mid-$2.00s.
On the flip side, the 100-EMA hurdle of $2.83 precedes the latest peak of around $2.93 and the $3.00 round figure to restrict the short-term upside of the Natural Gas price.
Following that, the yearly high marked in March at around $3.08 will be in the spotlight.
To sum up, the XNG/USD is likely to witness further pullback in the price but the bears are far from taking control.
Natural Gas Price: Daily chart
Trend: Limited downside expected
Author

Anil Panchal
FXStreet
Anil Panchal has nearly 15 years of experience in tracking financial markets. With a keen interest in macroeconomics, Anil aptly tracks global news/updates and stays well-informed about the global financial moves and their implications.


