|

Natural Gas Price Analysis: XNG/USD approaches $2.23 hurdle on bullish RSI divergence

  • Natural Gas price picks up bids to refresh intraday high, snaps two-day downtrend.
  • Higher low of XNG/USD price contradicts with lower lows of RSI to suggest further recovery.
  • Immediate resistance line holds the key to further upside, weekly top prods Natural Gas buyers.
  • XNG/USD bears need validation from $2.12 to retake control.

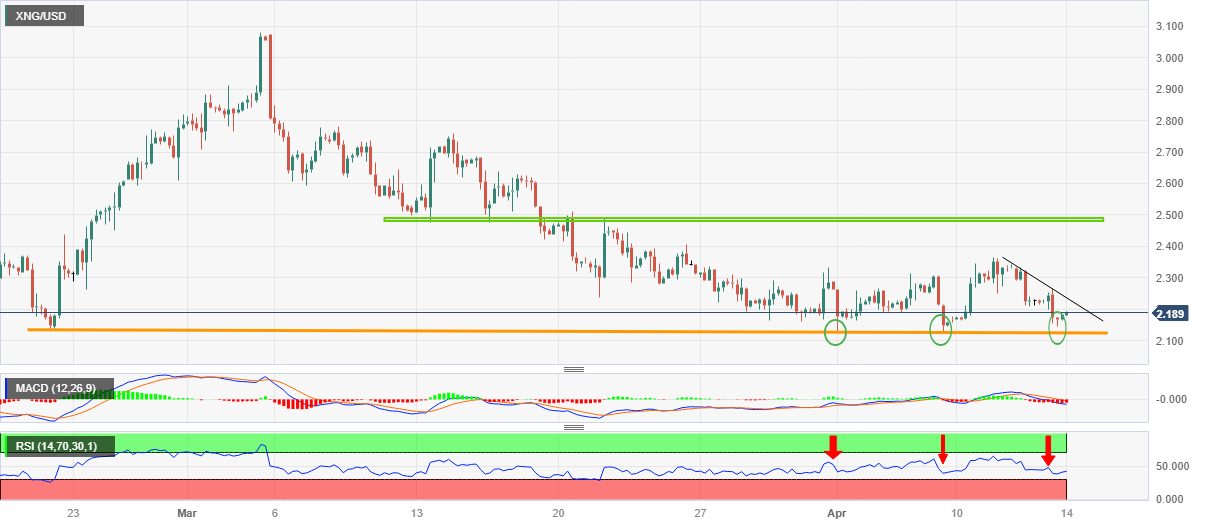
Natural Gas (XNG/USD) price renews intraday high near $2.20 as the energy instrument defies the previous two-day losing streak during early Friday. In doing so, the XNG/USD justifies hidden bullish RSI (14) divergence on the four-hour chart.

That said, Natural Gas price printed higher lows in the last two weeks but the RSI conditions commensurate to these troughs remain contradicting as the RSI (14) line marks a lower low. As a result, the price momentum towards the upside seems to gain acceptance and hence the XNG/USD buyers can expect more recovery.

However, a downward-sloping resistance line from Tuesday, near $2.23 by the press time, guards the quote’s immediate upside ahead of the weekly top surrounding $2.36.

Following that, a one-month-old horizontal resistance area surrounding $2.47-50 will be a tough nut to crack for the Natural Gas buyers before retaking the command.

Alternatively, pullback moves remain elusive unless the XNG/USD stays beyond an ascending support line stretched from late February, around $2.12 at the latest.

Even so, the $2.00 psychological magnet can challenge the Natural Gas bears before directing them to the July 2020 high of around $1.96.

XNG/USD: Four-hour chart

Trend: Further recovery expected

Author

Anil Panchal

Anil Panchal

FXStreet

Anil Panchal has nearly 15 years of experience in tracking financial markets. With a keen interest in macroeconomics, Anil aptly tracks global news/updates and stays well-informed about the global financial moves and their implications.

More from Anil Panchal
Share:

Editor's Picks

EUR/USD appears supported by the 200-day SMA, for now

Following an early pullback to multi-week lows near 1.1670, EUR/USD now manages to reclaim the 1.1700 region as the NA session draws to a close on Monday. The steep retracement in spot follows the equally strong move higher in the US Dollar, as investors continue to assess the geopolitical landscape in the wake of the US and Israel attacks on Iran.


GBP/USD hits new yearly lows near 1.3300

GBP/USD adds to the recent bearish tone, approaching to the key 1.3300 support to reach fresh YTD troughs against the backdrop of the robust performance of the US Dollar. Indeed, Cable’s decline comes amid the firm demand for the safe-haven space in the wake of the US and Israel attacks to Iran.

Gold clings to gains as US-Iran conflict continues to underpin safe-haven assets

Gold retains positive bias for the fifth consecutive day on Tuesday as rising geopolitical tensions in the Middle East continue to underpin safe-haven assets. However, a bullish US Dollar could keep the bullion below its highest level since late January, set on Monday, warranting caution before positioning for any further appreciation.

Strategy lifts holdings to 3.4% of Bitcoin's total supply amid inflows into crypto products

Strategy continued its accumulation of the top crypto last week, acquiring 3,015 BTC for $204 million amid renewed interest in crypto products after four weeks of outflows.

The Fed is finally talking about AI – Here's why it matters for the US Dollar

AI is moving from earnings calls into the heart of monetary policy discussions, forcing Federal Reserve officials to confront a new question: How to act if AI reshapes inflation, employment and interest rates at the same time?

Grass 20% bullish breakout defies broader market weakness

Grass (GRASS) is edging up above $0.30 at the time of writing on Monday. The token’s notable 20% intraday surge stands out amid heightened volatility in the broader crypto market.