Nasdaq futures hold key structure as price compresses toward major resistance zones

Daily projections and intraday micro-structure converge as futures compress inside key zones.
Nasdaq futures respect key structural zones ahead of the next expansion move
Friday's price action reinforced the structural roadmap outlined in the previous analysis, with both the daily Chart and the intraday 5-minute structure validating the projected levels. The market continues to follow the same behavioural patterns displayed throughout the past week, allowing the MacroStructure framework to once again provide early clarity on the next likely move.
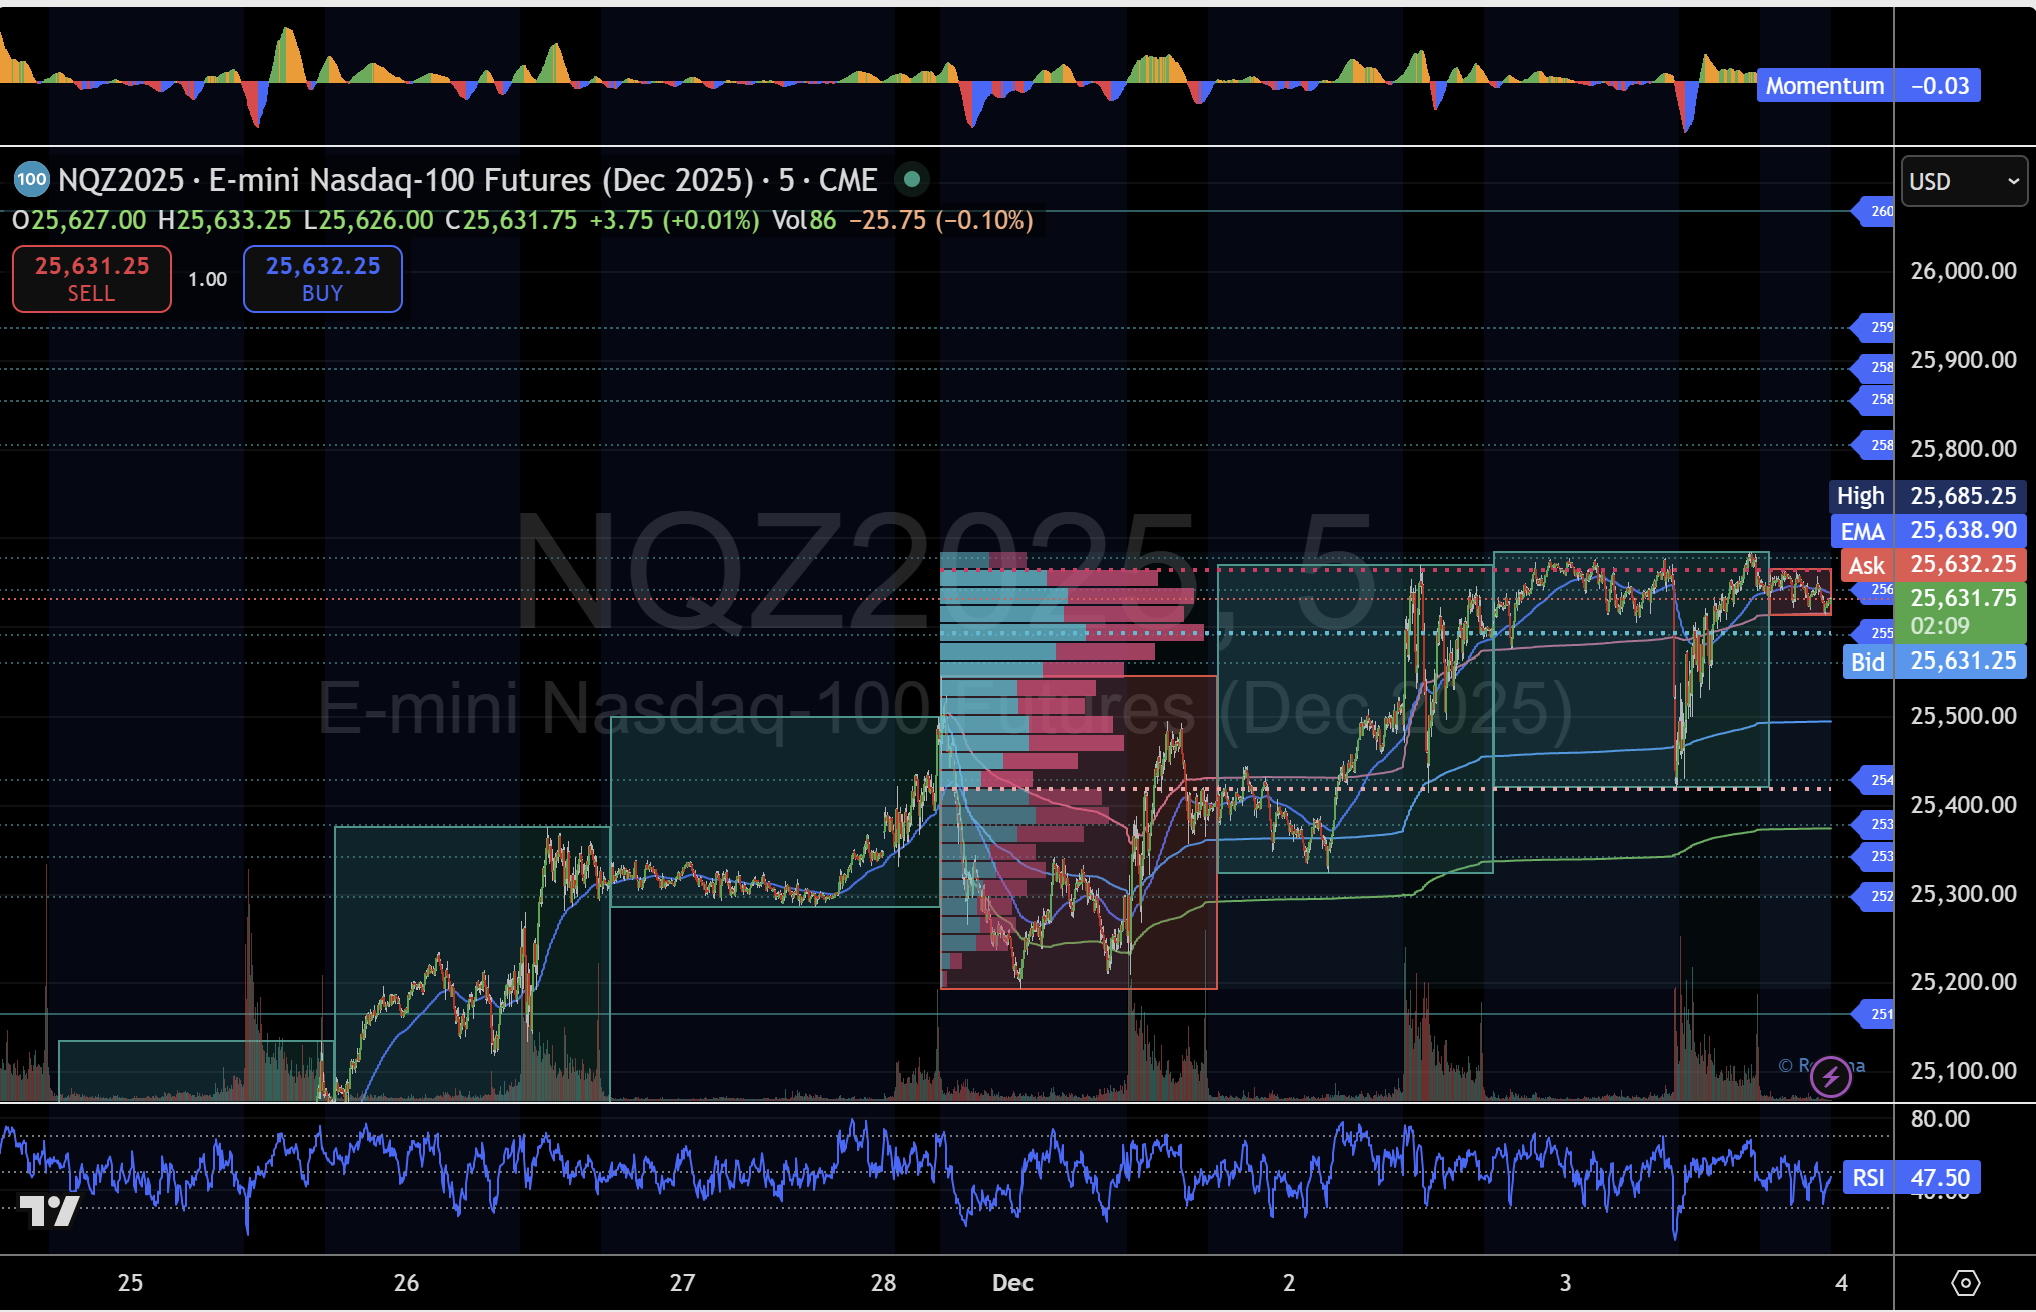
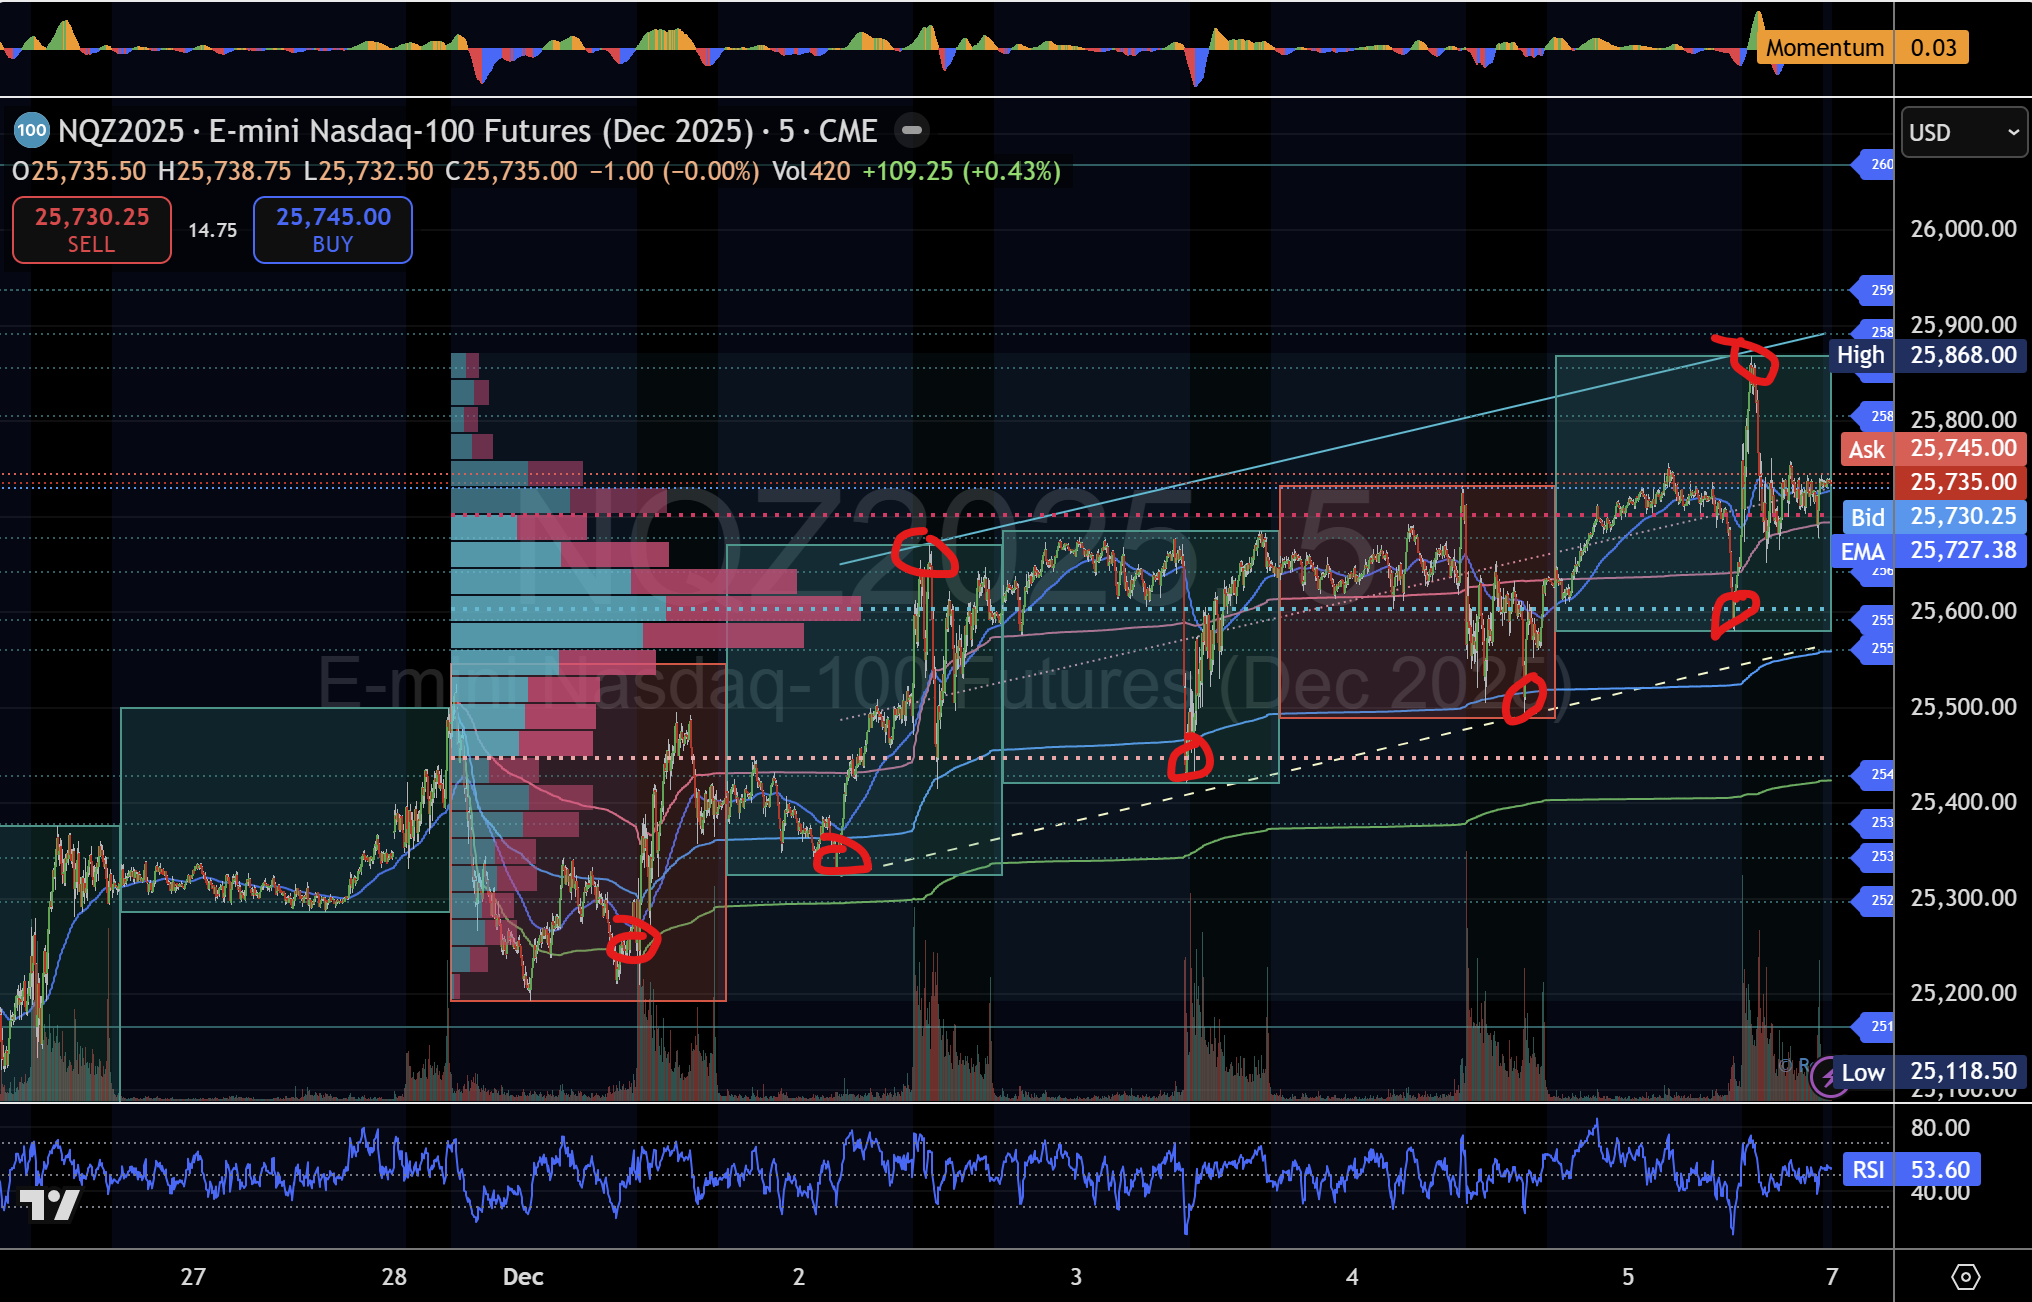
Intraday five-minute structure: Three identical zones continue to guide price
At Friday's open, Nasdaq futures pulled back into the middle structure near 25,591, where buyers stepped in decisively, forming another clean high–low rotation. This confirms the middle zone as the intraday trend's central pivot.
From there, Price advanced into the upper structure at 25,805 – 25,855, touching the upper boundary of the rising micro-channel before rotating lower — exactly as projected in the earlier analysis. This reaction further validates the consistency of the three identical structural zones, which continue to function as repeatable supply/demand footprints.
Key structural levels to monitor
- Middle structure (25,560 – 25,677): The intraday decision zone. Holding above this range keeps bullish continuation intact.
- Upper structure (25,805 – 25,936): A breakout zone that, if reclaimed, opens the next leg toward daily targets.
- Lower structure (25,428 – 25,297): Failure of the middle zone exposes this liquidity pocket and rotation area.
These recurring structures provide traders with a reliable framework for anticipating directional moves before they occur.
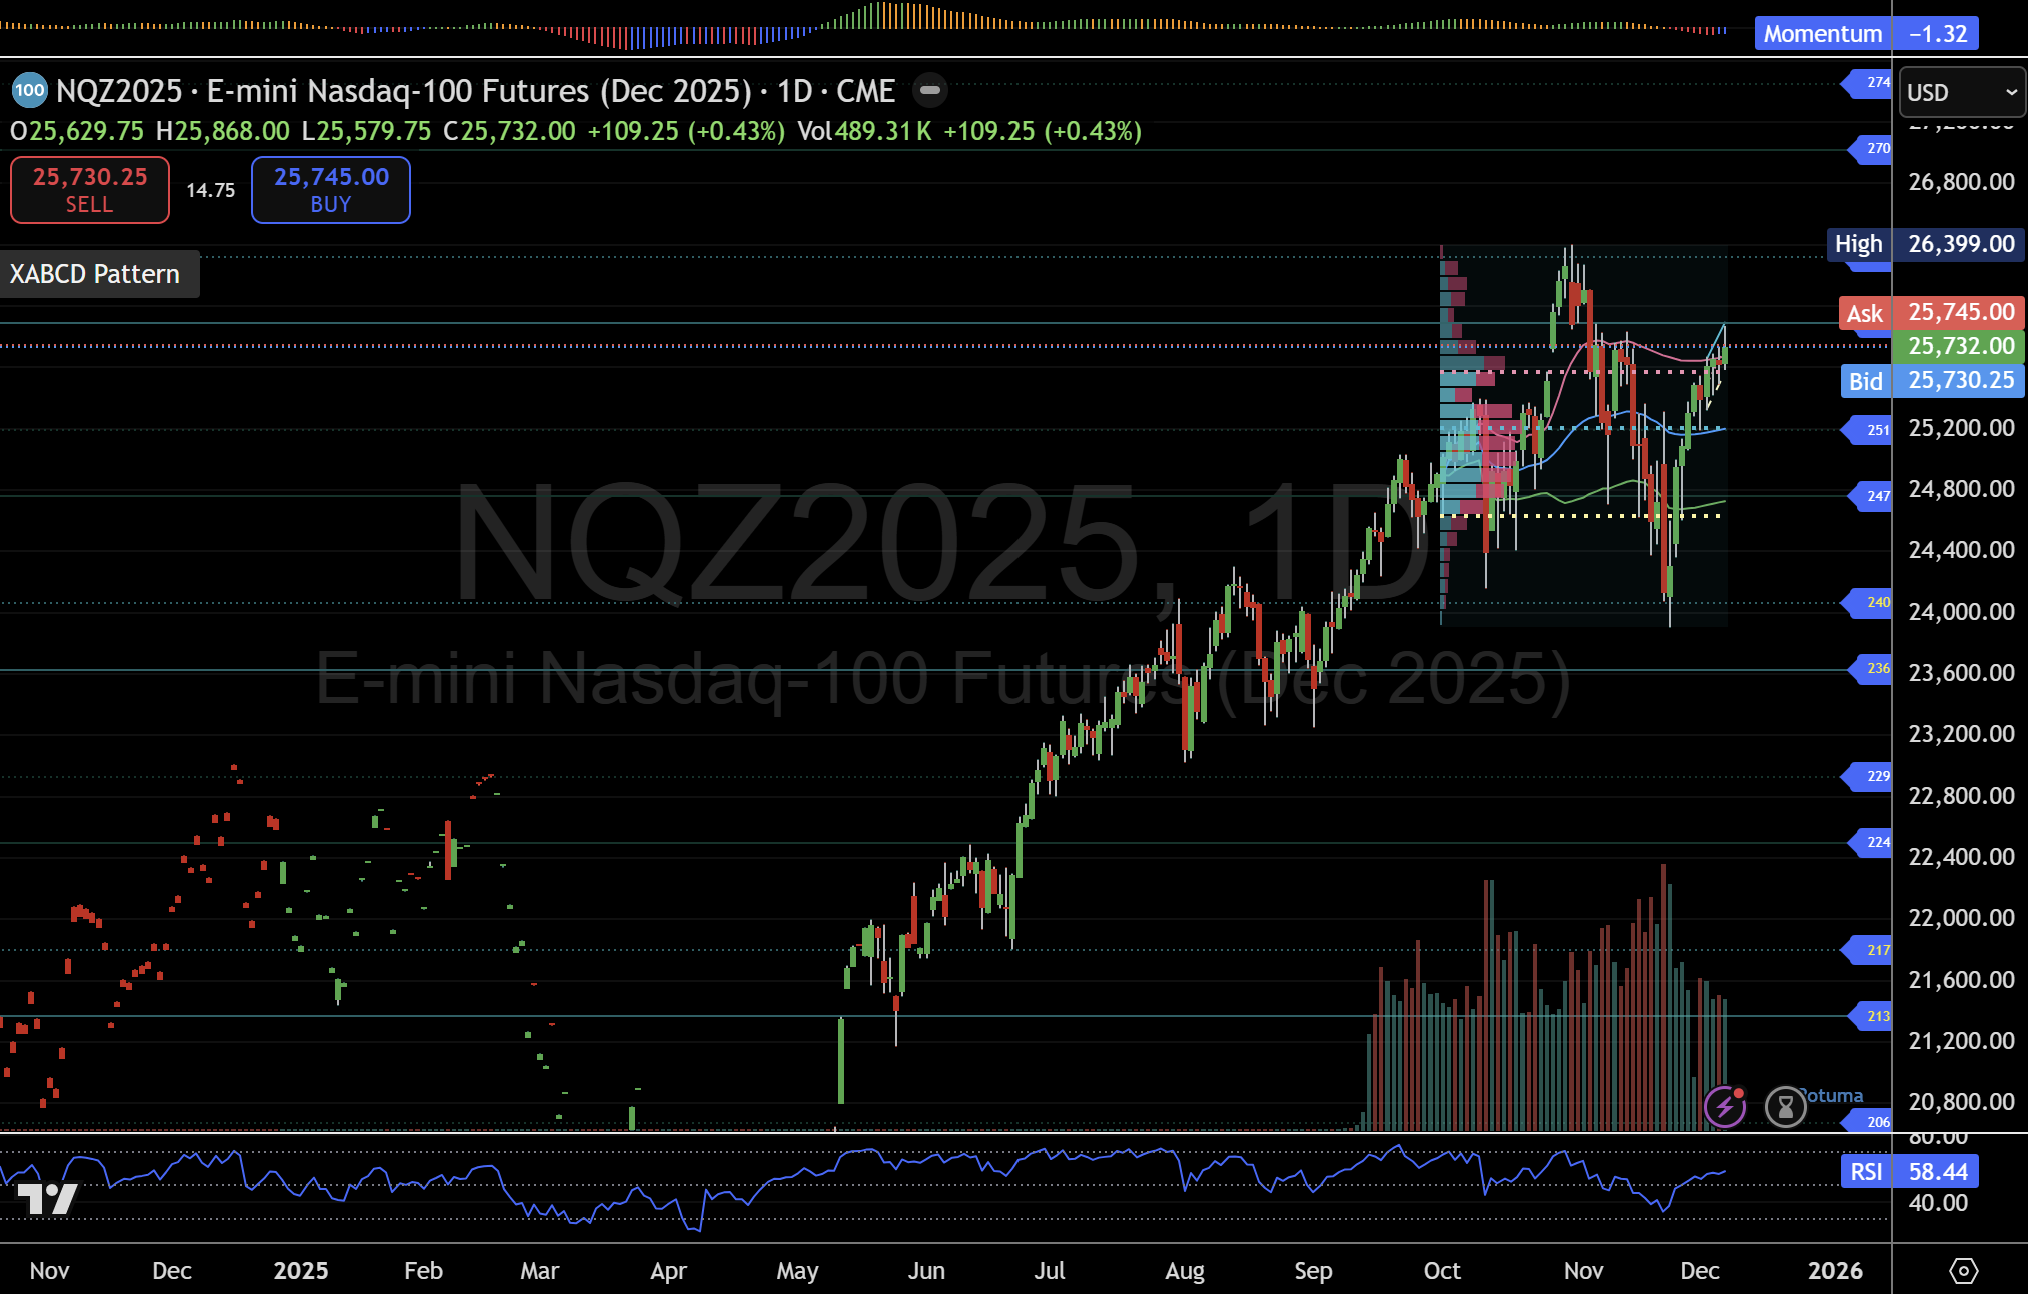
Daily chart: Strong close above VAH supports higher projections
On the higher timeframe, Friday's close held above the value area high (VAH) at 25,575, aligning with the high-volume trading footprint seen through early to mid-November. This structural support suggests continued acceptance at these levels, which keeps the bullish case intact.
If Price maintains this foothold, the next major upside targets sit at 25,888–26,320, a zone that has remained in play since the original MacroStructure projection. These levels represent key daily inflexion points that the market may revisit if the current structure holds.
Structural outlook — What needs to happen next
Bullish scenario
- Hold 25,560 – 25,677
- Break and accept above 25,805
- Target 25,936, then daily levels at 25,888 – 26,320
Bearish scenario
- Lose 25,560
- Rotate back into 25,428 – 25,297
- Assess for structural weakness or potential continuation setup
These conditions remain the roadmap for the next sessions as futures consolidate inside a narrowing price structure.
Daily and intraday confluence continues to lead price
The convergence between daily projections and intraday structure remains the strongest guiding force. Nasdaq futures have respected each rotational zone with precision, reinforcing a market environment where structure leads Price, and when structure eventually aligns with fundamental catalysts, major moves tend to unfold.
This analysis is for informational purposes only and does not constitute investment advice. Markets involve risk, and past performance does not guarantee future results.
Author

Denis Joeli Fatiaki
Independent Analyst
Denis Joeli Fatiaki possesses over a decade of extensive experience as a multi-asset trader and Market Strategist.


