|premium|

Nasdaq futures: Forecasting the rally from the blue box area

Nasdaq futures rallied over 1600 points during the last 30 days of trading. It found a low at 14372 on October 4, 2021 and has not looked back since then. After a couple of tests of the lows, it accelerated higher and has already made a new all time high reaching 15980 on November 2, 2021. When Nasdaq futures was selling off in September, our members knew that the decline was a corrective pull back and nothing more than an another buying opportunity. Let’s take a look at some charts of Nasdaq futures from members area showing how we called a move into the blue box area and a rally from there.

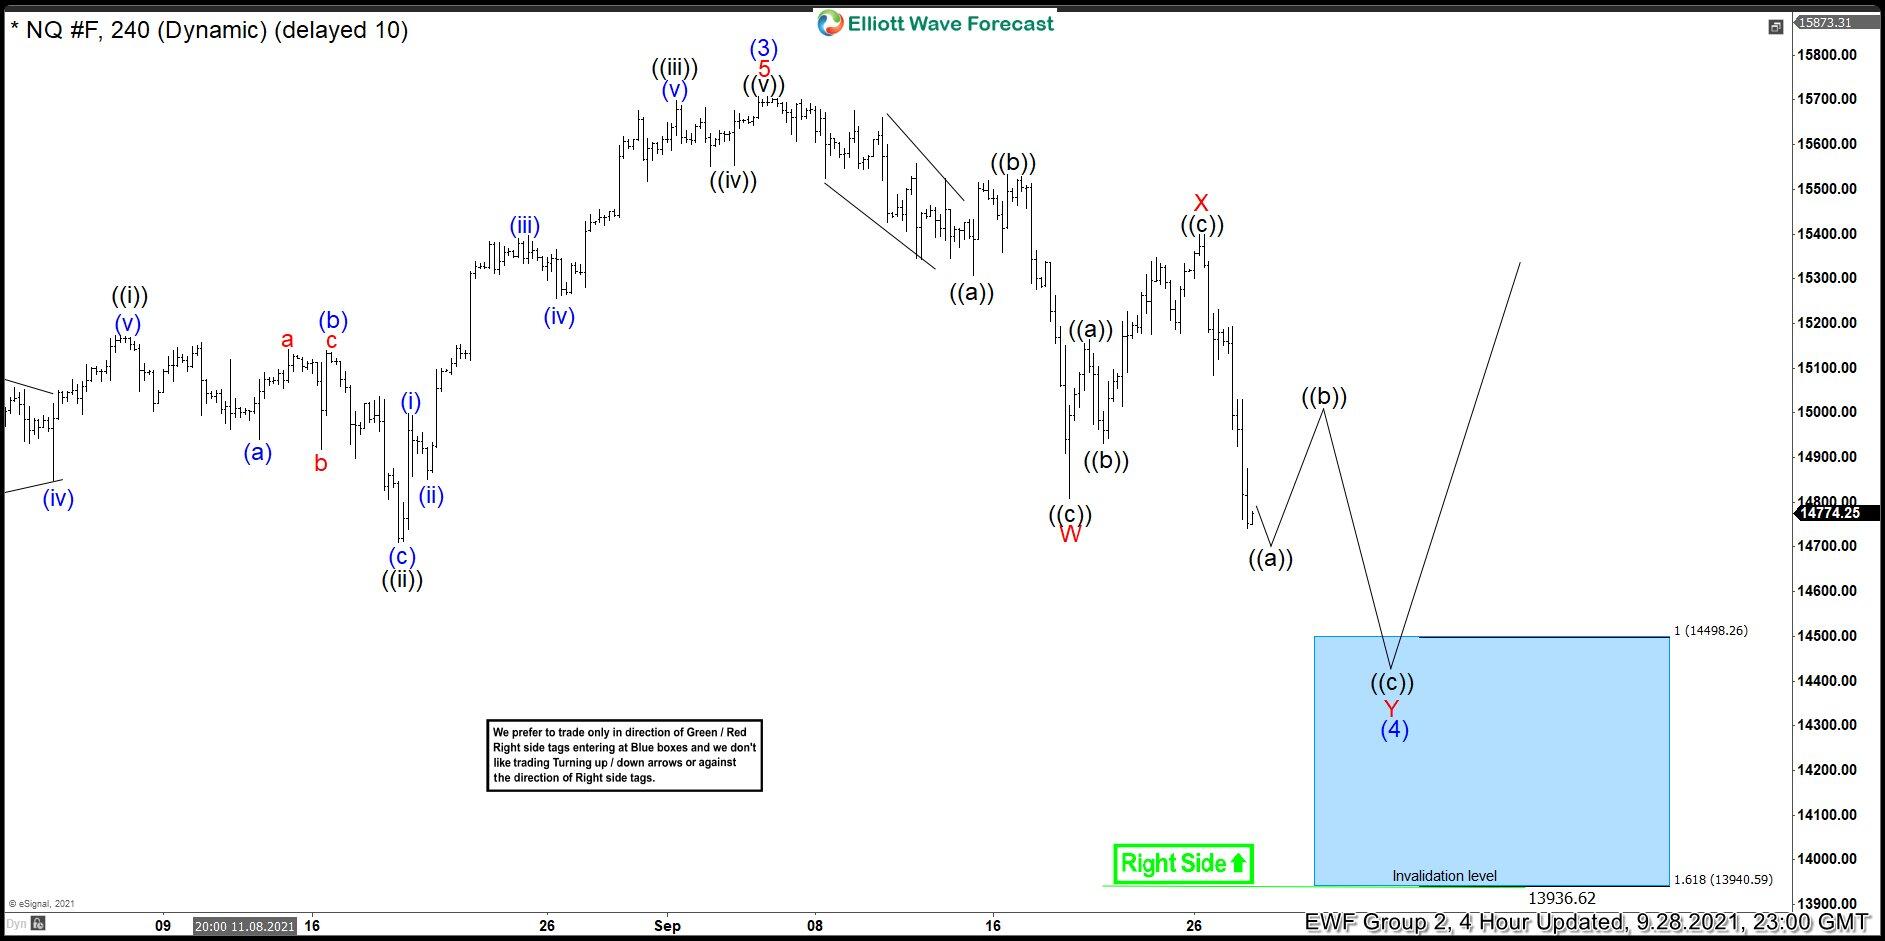
Nasdaq Futures 28 September 4 Hour Elliott Wave Analysis

Chart below shows NQ_F in a double three correction. We expected a bounce in wave ((b)) to fail for another leg lower towards 14498 – 13940 area to complete double three Elliott wave correction. Then we expected the rally to resume in wave (5) for a new all time high or for a 3 waves bounce at least.

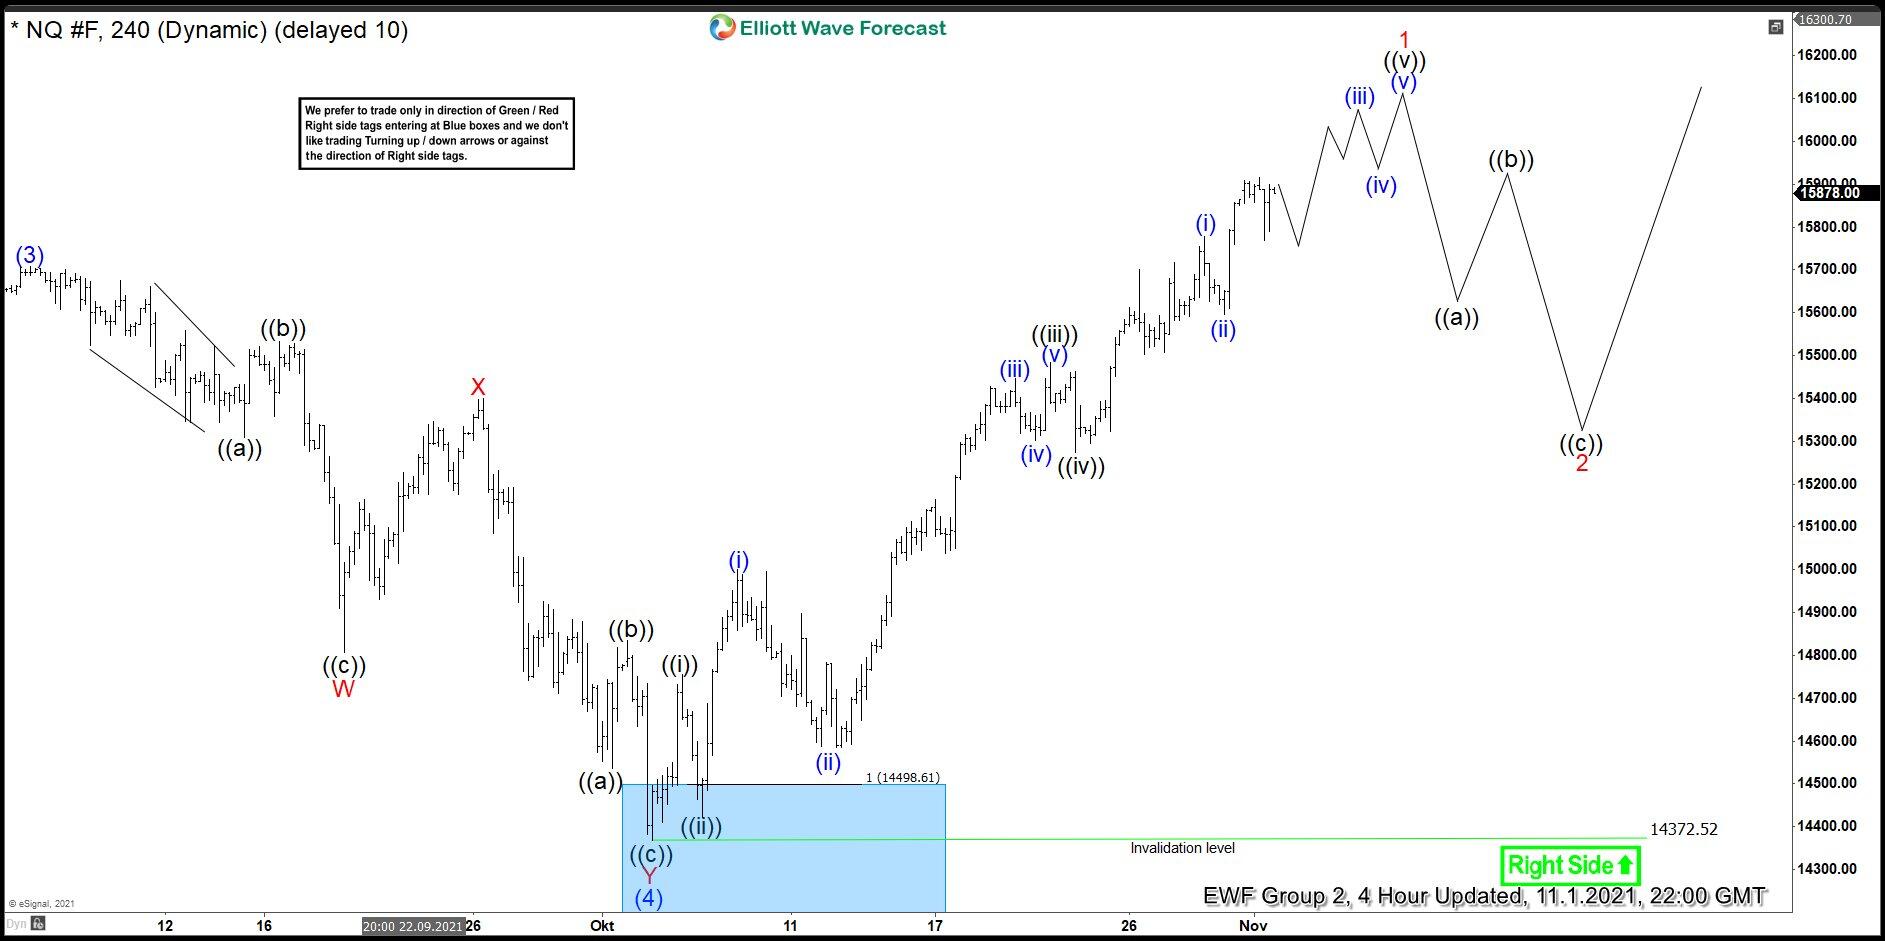
Nasdaq Futures 01 November 4 Hour Elliott Wave Analysis

Nasdaq reached a low of 14372 on 4 October, 2021 and reacted higher after buyers appeared in the blue box. There was some fight between buyers and sellers as it usually happens at start of a new cycle. After testing the low a couple of times, Nasdaq futures accelerated higher which means two test of the low became Elliott wave nests and they are now being resolved. Nasdaq futures already managed to break above wave (3) high which is also a new all time high. Cycle from 14372 (4 October, 2021) low is mature and close to ending. 16026 – 16540 is inverse 1.236 – 1.618 Fibonacci extension of wave (4) pull back and we expect a cycle to end in this area after which Nasdaq should pull back in 3 waves at least.

Premium

You have reached your limit of 3 free articles for this month.

Start your subscription and get access to all our original articles.

Subscribe to PremiumSign In

Author

Elliott Wave Forecast Team

Elliott Wave Forecast Team

ElliottWave-Forecast.com

More from Elliott Wave Forecast Team
Share:

Editor's Picks

EUR/USD accelerates losses, focus is on 1.1800

EUR/USD’s selling pressure is gathering pace now, opening the door to a potential test of the key 1.1800 region sooner rather than later. The pair’s pullback comes on the back of marked gains in the US Dollar following US data releases and the publication of the FOMC Minutes later in the day.

GBP/USD turns negative near 1.3540

GBP/USD reverses its initial upside momentum and is now adding to previous declines, revisiting at the same time the 1.3540 region on Wednesday. Cable’s downtick comes on the back of decent gains in the Greenback and easing UK inflation figures, which seem to have reinforced the case for a BoE rate cut in March.

Gold picks pace, flirts with $5,000

Gold is back on the front foot on Wednesday, shaking off part of the early week softness and pushing higher towards the key $5,000 mark per troy ounce. The move comes ahead of the FOMC Minutes and is unfolding despite an intense rebound in the US Dollar.

Fed Minutes to shed light on January hold decision amid hawkish rate outlook

The Minutes of the Fed’s January 27-28 monetary policy meeting will be published today. Details of discussions on the decision to leave the policy rate unchanged will be scrutinized by investors.

Mixed UK inflation data no gamechanger for the Bank of England

Food inflation plunged in January, but service sector price pressure is proving stickier. We continue to expect Bank of England rate cuts in March and June. The latest UK inflation read is a mixed bag for the Bank of England, but we doubt it drastically changes the odds of a March rate cut.

Sui extends sideways action ahead of Grayscale’s GSUI ETF launch

Sui is extending its downtrend for the second consecutive day, trading at 0.95 at the time of writing on Wednesday. The Layer-1 token is down over 16% in February and approximately 34% from the start of the year, aligning with the overall bearish sentiment across the crypto market.