NASDAQ forecast: Is Nasdaq topping out? All-time highs or now?
- Nasdaq is stalling beneath a major Daily Bearish FVG, raising the question of whether the index is topping out.
- Rate-cut expectations remain supportive, but fading momentum and narrowing tech breadth signal potential exhaustion.
- Key inflection levels on the Daily and 4H charts will determine whether Nasdaq pushes toward all-time highs or rotates into a deeper pullback.
Is the Nasdaq running out of momentum — Or coiling for a final breakout?
The Nasdaq’s recent rally has been impressive, but the index is now confronting the same premium zone that triggered a sell-off earlier. That alone sets the stage for hesitation—but when combined with softer breadth, mixed macro data, and a market priced for December easing, the current stall becomes far more meaningful.
Price is compressing into a Daily Bearish Fair Value Gap, a region where institutional order flow previously reversed aggressively. And instead of a confident expansion through the zone, the Nasdaq is printing hesitation candles, lower-timeframe rejections, and a tight 4H consolidation box.
This is exactly how tops form.
But it’s also exactly how breakouts form.
Which one it becomes depends entirely on the next move through 25,771.6.
Fundamental drivers: Rate-cut expectations meet market fatigue
Rate-cut speculation still favors risk assets
Markets continue to anticipate a December rate cut, with softer labor data and cooling inflation supporting the case. This has kept tech elevated—rate-sensitive assets typically benefit from lower yields.
But the Fed’s messaging remains cautious, reinforcing the idea that any December cut will be tactical, not aggressive. Markets want confirmation, not uncertainty.
Tech leadership is still present, but narrowing
Mega caps have carried most of the recent gains.
When leadership narrows, the index can still rise—but moves become fragile, vulnerable, and prone to sharp reversals.
This narrowing often appears near market tops.
Why Nasdaq is struggling at this level
Recent high-impact events (NFP, ISM, labor trends) supplied enough optimism to push Nasdaq upward—but not enough strength to blow through a major HTF imbalance.
Every rally attempt into the Daily Bearish FVG encounters supply.
Every rejection deepens the question: Is this distribution?
Nasdaq is now waiting for the next macro catalyst to decide direction.
A dovish shift could send price toward all-time highs.
A hawkish or uncertain tone could trigger a deeper correction.
Technical outlook
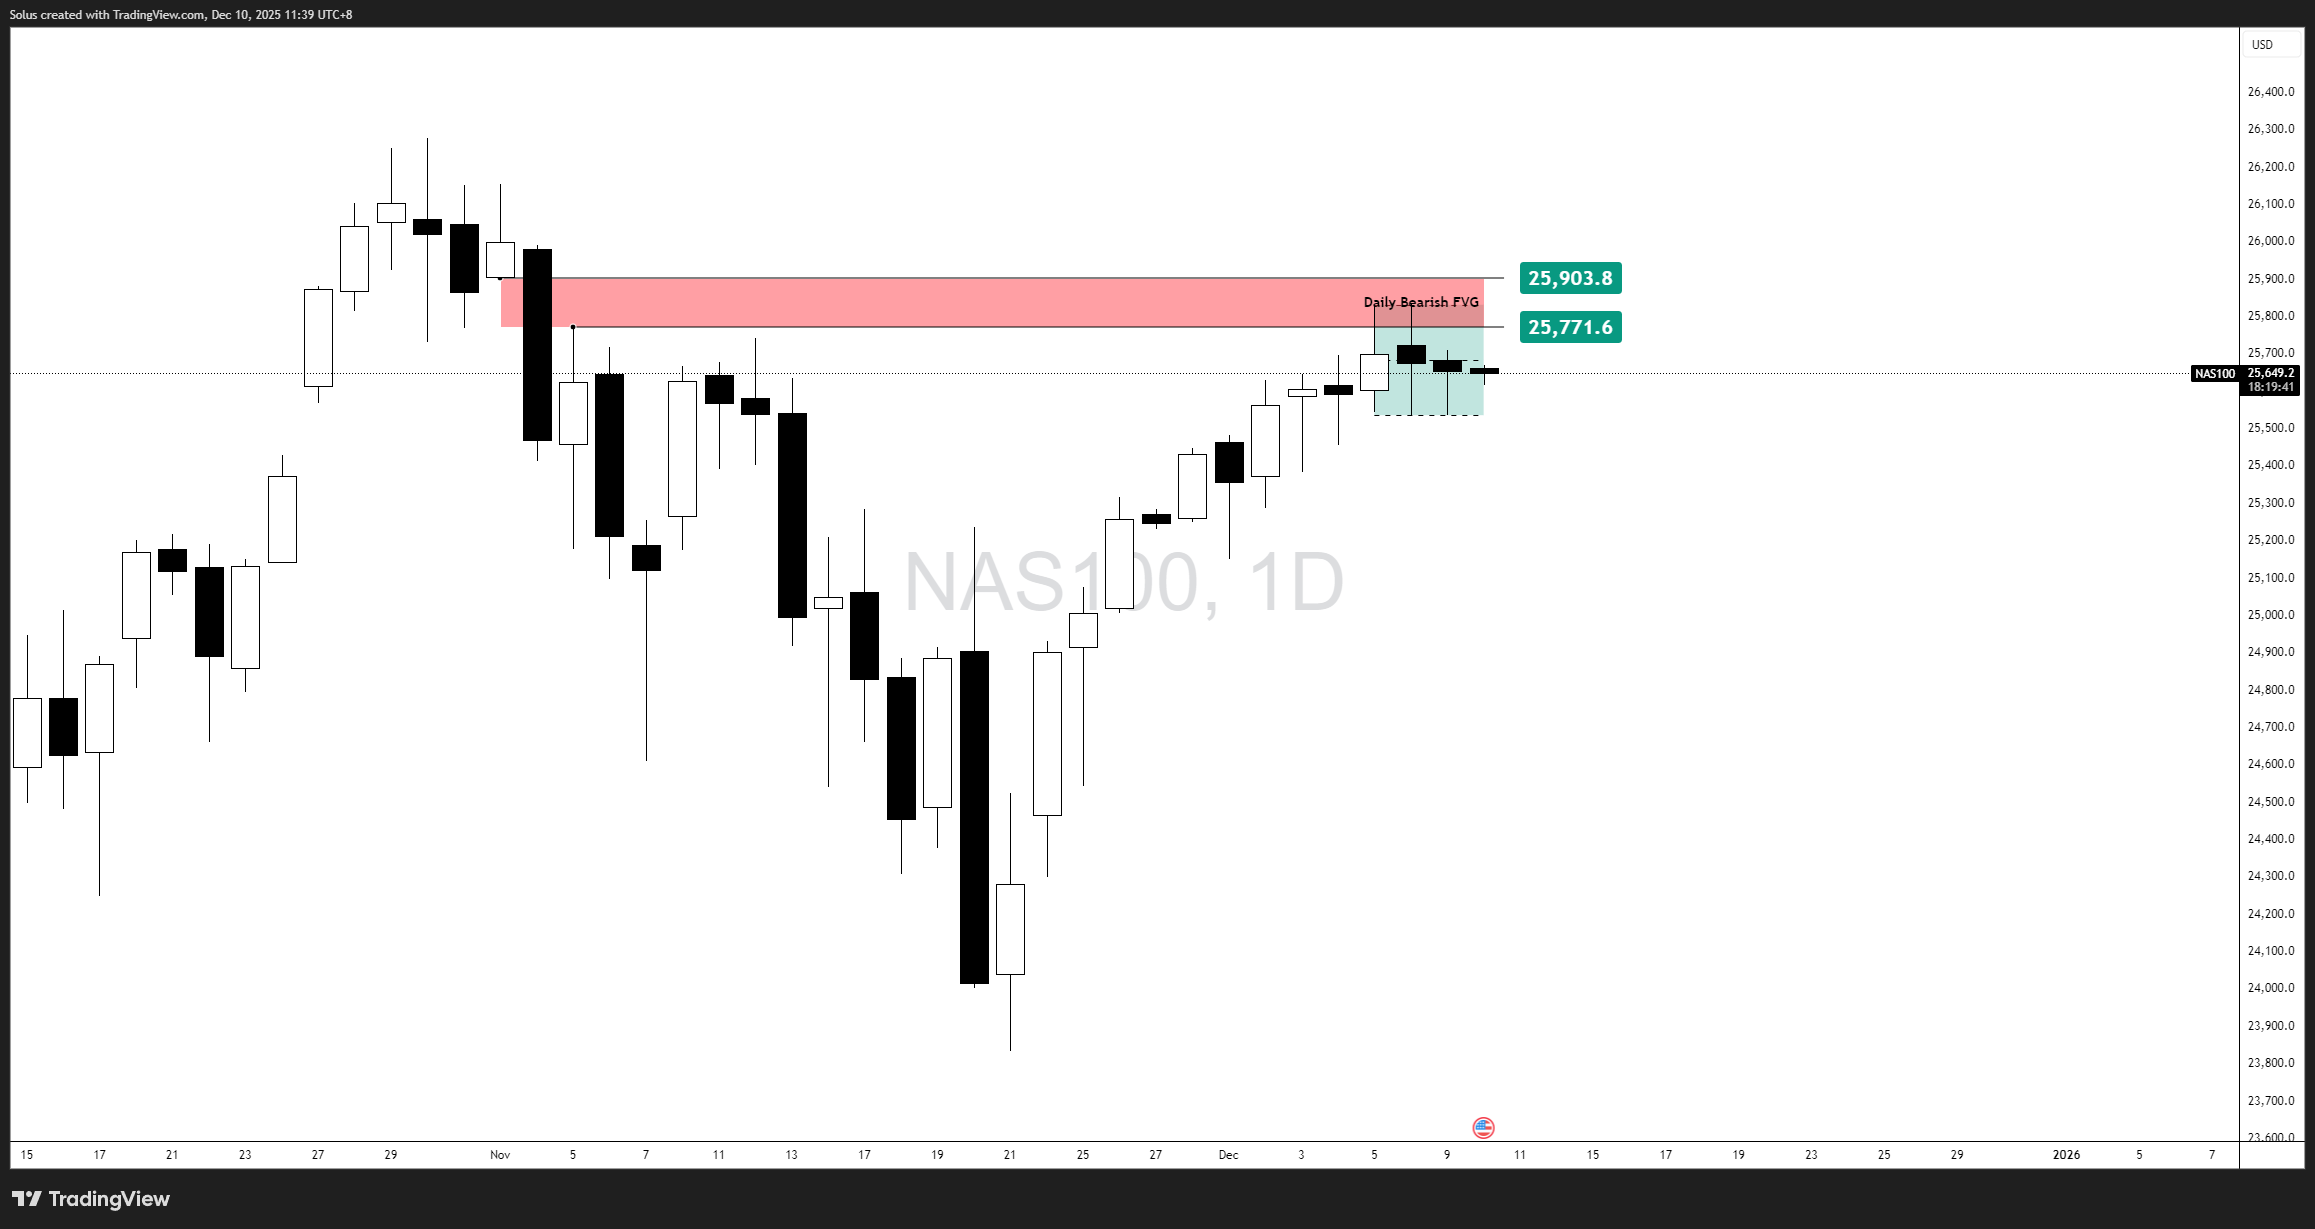
Nasdaq is currently pressing into a Daily Bearish Fair Value Gap (FVG)—a zone between:
- 25,771.6.
- 25,903.8.
This zone is the “last wall” before Nasdaq can attempt a push toward all-time highs.
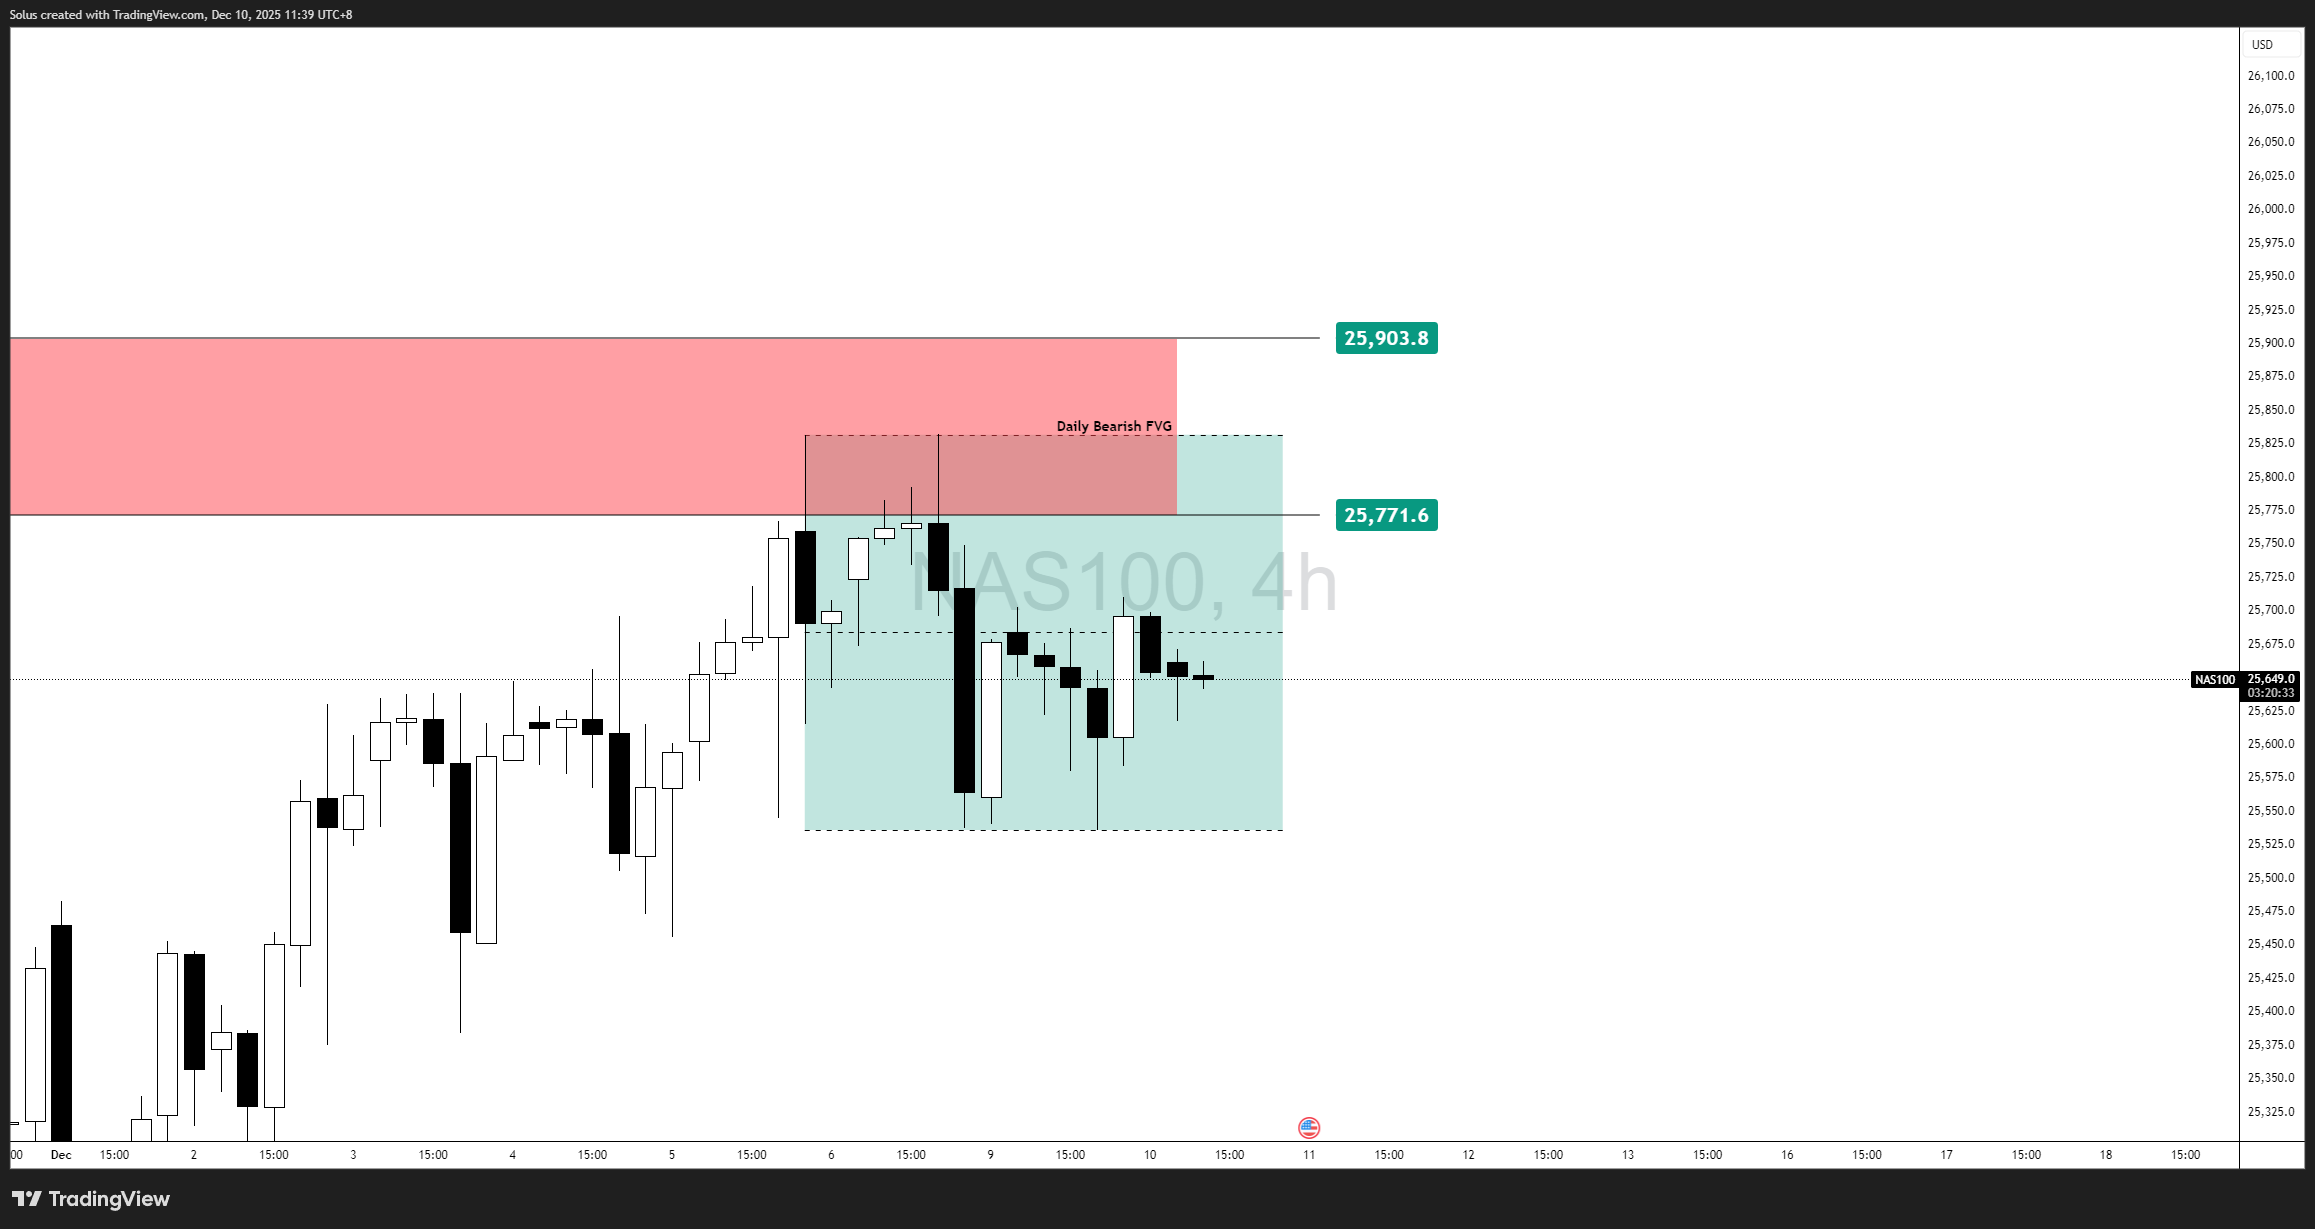
But right now, price is rejecting from within it.
Rejection = distribution risk.
Breakthrough = expansion toward new highs.
The 4H shows a clean liquidity-engineered range, with internal lows and highs forming inside a compression structure. Price has not yet broken from this box, meaning volatility is building.
Key level to watch: 25,771.6.
- Above it = bullish continuation.
- Failure at it = bearish reversal.
This level is the hinge for the next major move.
Bullish scenario: Breakout through the FVG
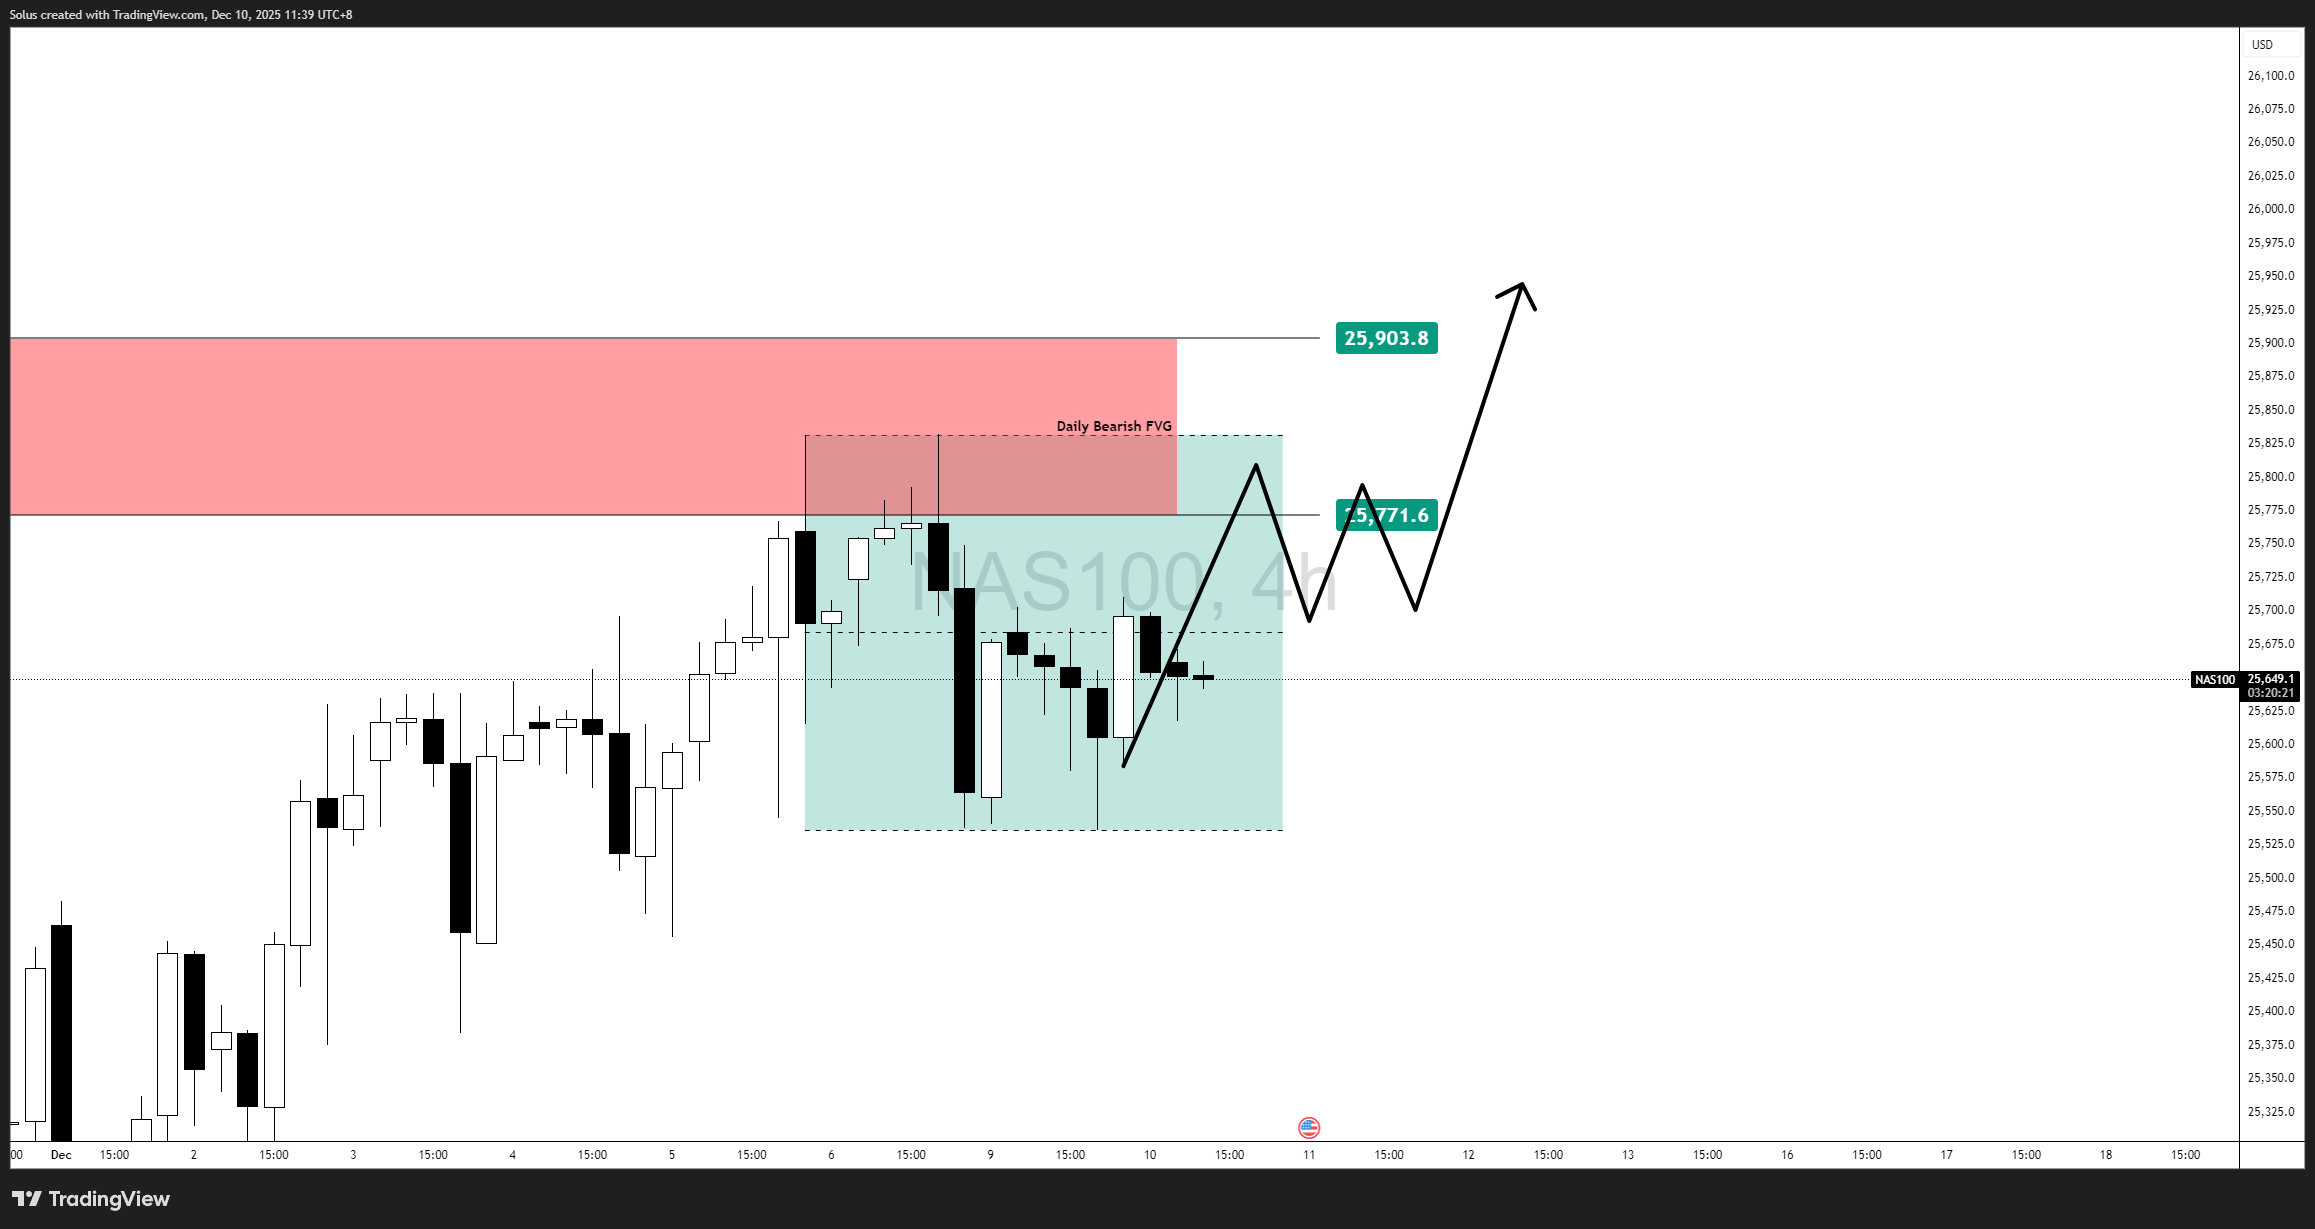
For Nasdaq to confirm strength:
- Break above 25,771.6.
- A clean 4H close above that zone.
- Retest → hold → continuation.
If this occurs, upside targets include:
- 25,903.8 (FVG fill).
- 26,050 – 26,150 liquidity pocket.
- Continuation toward all-time highs.
This path requires supportive macro data or renewed tech strength.
Bearish scenario: Topping formation and breakdown
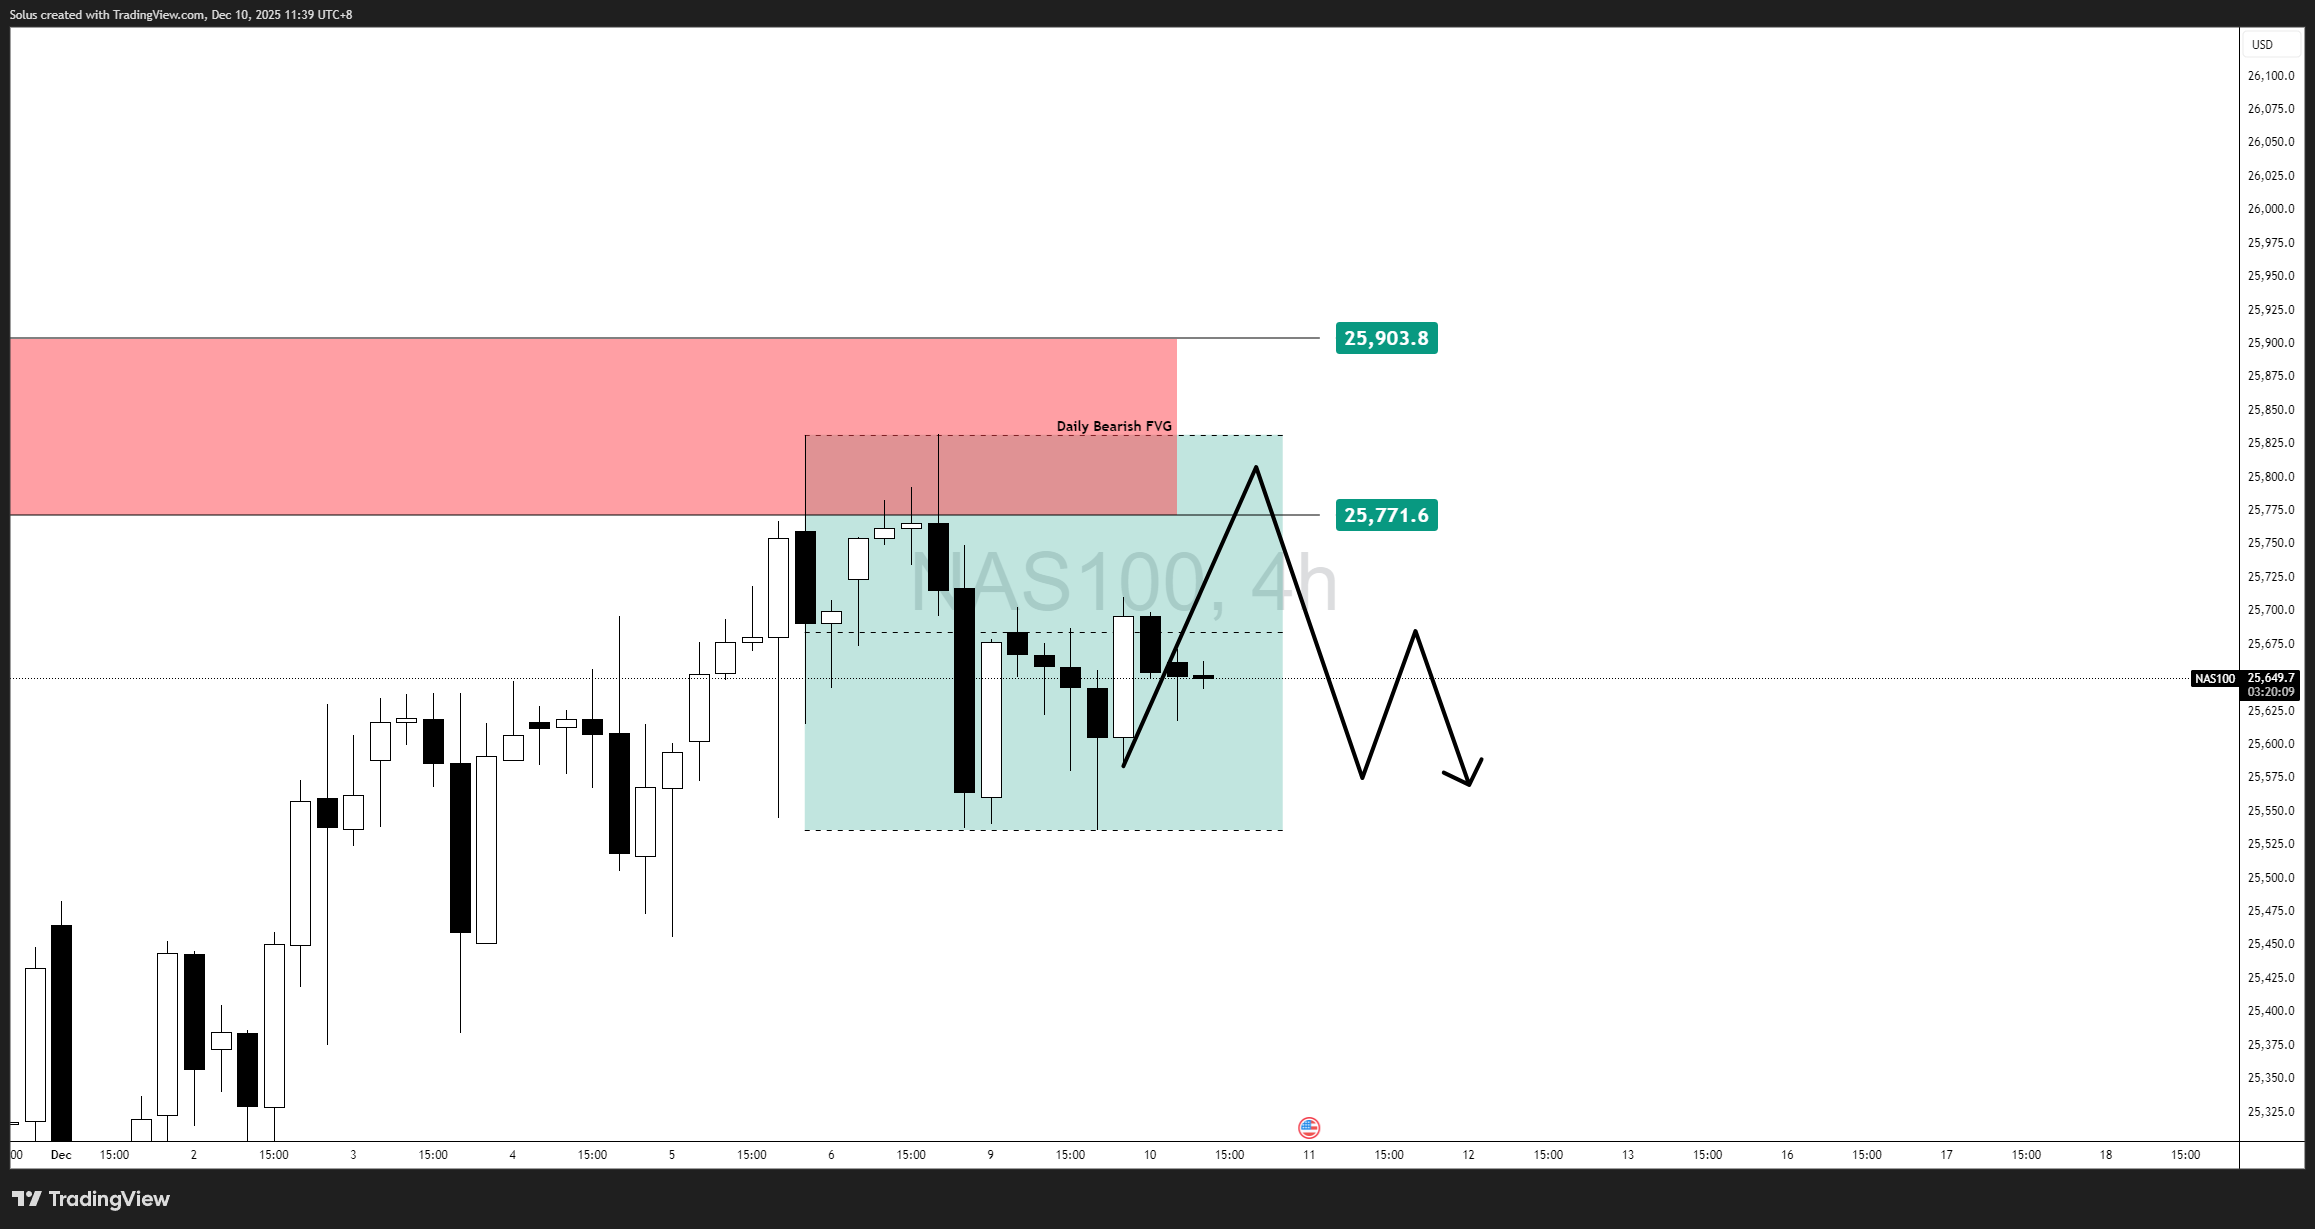
Signs Nasdaq is topping out:
- Repeated rejections inside the Daily FVG.
- Failure to close above 25,771.6.
- Breakdown of 4H internal liquidity (blue box).
If price fails at the FVG again, expect:
- 25,500 – 25,450 (inefficiency fill).
- 25,300 (clean liquidity pool).
This bearish path aligns with distribution behavior at premium pricing.
Final thoughts
Nasdaq is at a fork in the road.
The index has the momentum, the narrative, and the liquidity to break higher—but it also has the structure, exhaustion signs, and resistance to roll over sharply.
This is a classic “top or breakout” moment.
Until price decisively breaks out of the Daily FVG or collapses through the 4H range, traders should expect:
- choppy, liquidity-driven moves.
- engineered sweeps.
- false breaks before the real expansion.
Author

Jasper Osita
Independent Analyst
Jasper has been in the markets since 2019 trading currencies, indices and commodities like Gold. His approach in the market is heavily accompanied by technical analysis, trading Smart Money Concepts (SMC) with fundamentals in mind.

















