Nasdaq forecast: Interest rates cap the rally near key resistance
- NASDAQ remains capped by institutional supply, reacting below a Daily and H4 bearish Fair Value Gap, signaling controlled distribution rather than trend expansion.
- The primary driver of price action is interest-rate expectations, with elevated U.S. yields suppressing aggressive risk-on flows into tech.
- Technical Forecast: Unless price reclaims and holds above 25,900, NASDAQ favors a range-to-corrective structure, with downside risk toward 25,100-24,800 before any sustained breakout attempt.
Recovery without follow-through
NASDAQ has staged a sharp recovery from December lows, reclaiming key short-term moving averages and restoring upside structure. However, this recovery has lost momentum precisely where it matters most—beneath a Daily bearish Fair Value Gap between 25,770 and 25,900.
Rather than accelerating, price has transitioned into compression and overlap, a classic sign that buyers are present but constrained. This behavior suggests the market is not weak—but it is not in a full risk-on regime either.
The key takeaway:
NASDAQ is moving—but within macro-imposed boundaries.
The main driver: Interest rates are steering Nasdaq
The dominant force behind NASDAQ’s movement is not earnings optimism or AI enthusiasm—it is interest-rate expectations and U.S. Treasury yields.
As a growth-heavy index, NASDAQ is highly sensitive to the cost of capital. Elevated yields increase the discount rate applied to future earnings, compressing valuations across high-duration tech stocks.
This explains the current behavior:
- Strong rebounds from lows show buyers are still active.
- Rallies stall near premium zones as institutions sell into strength.
- Momentum exists, but follow-through is limited.
Recent Federal Reserve communication has reinforced a “higher for longer” stance, keeping risk appetite fragile. Even without fresh rate hikes, the persistence of restrictive policy conditions is enough to cap upside expansion.
As long as yields remain elevated, NASDAQ rallies are more likely to be sold than chased.
Technical outlook – Nasdaq at a decision zone
Higher timeframe (daily)
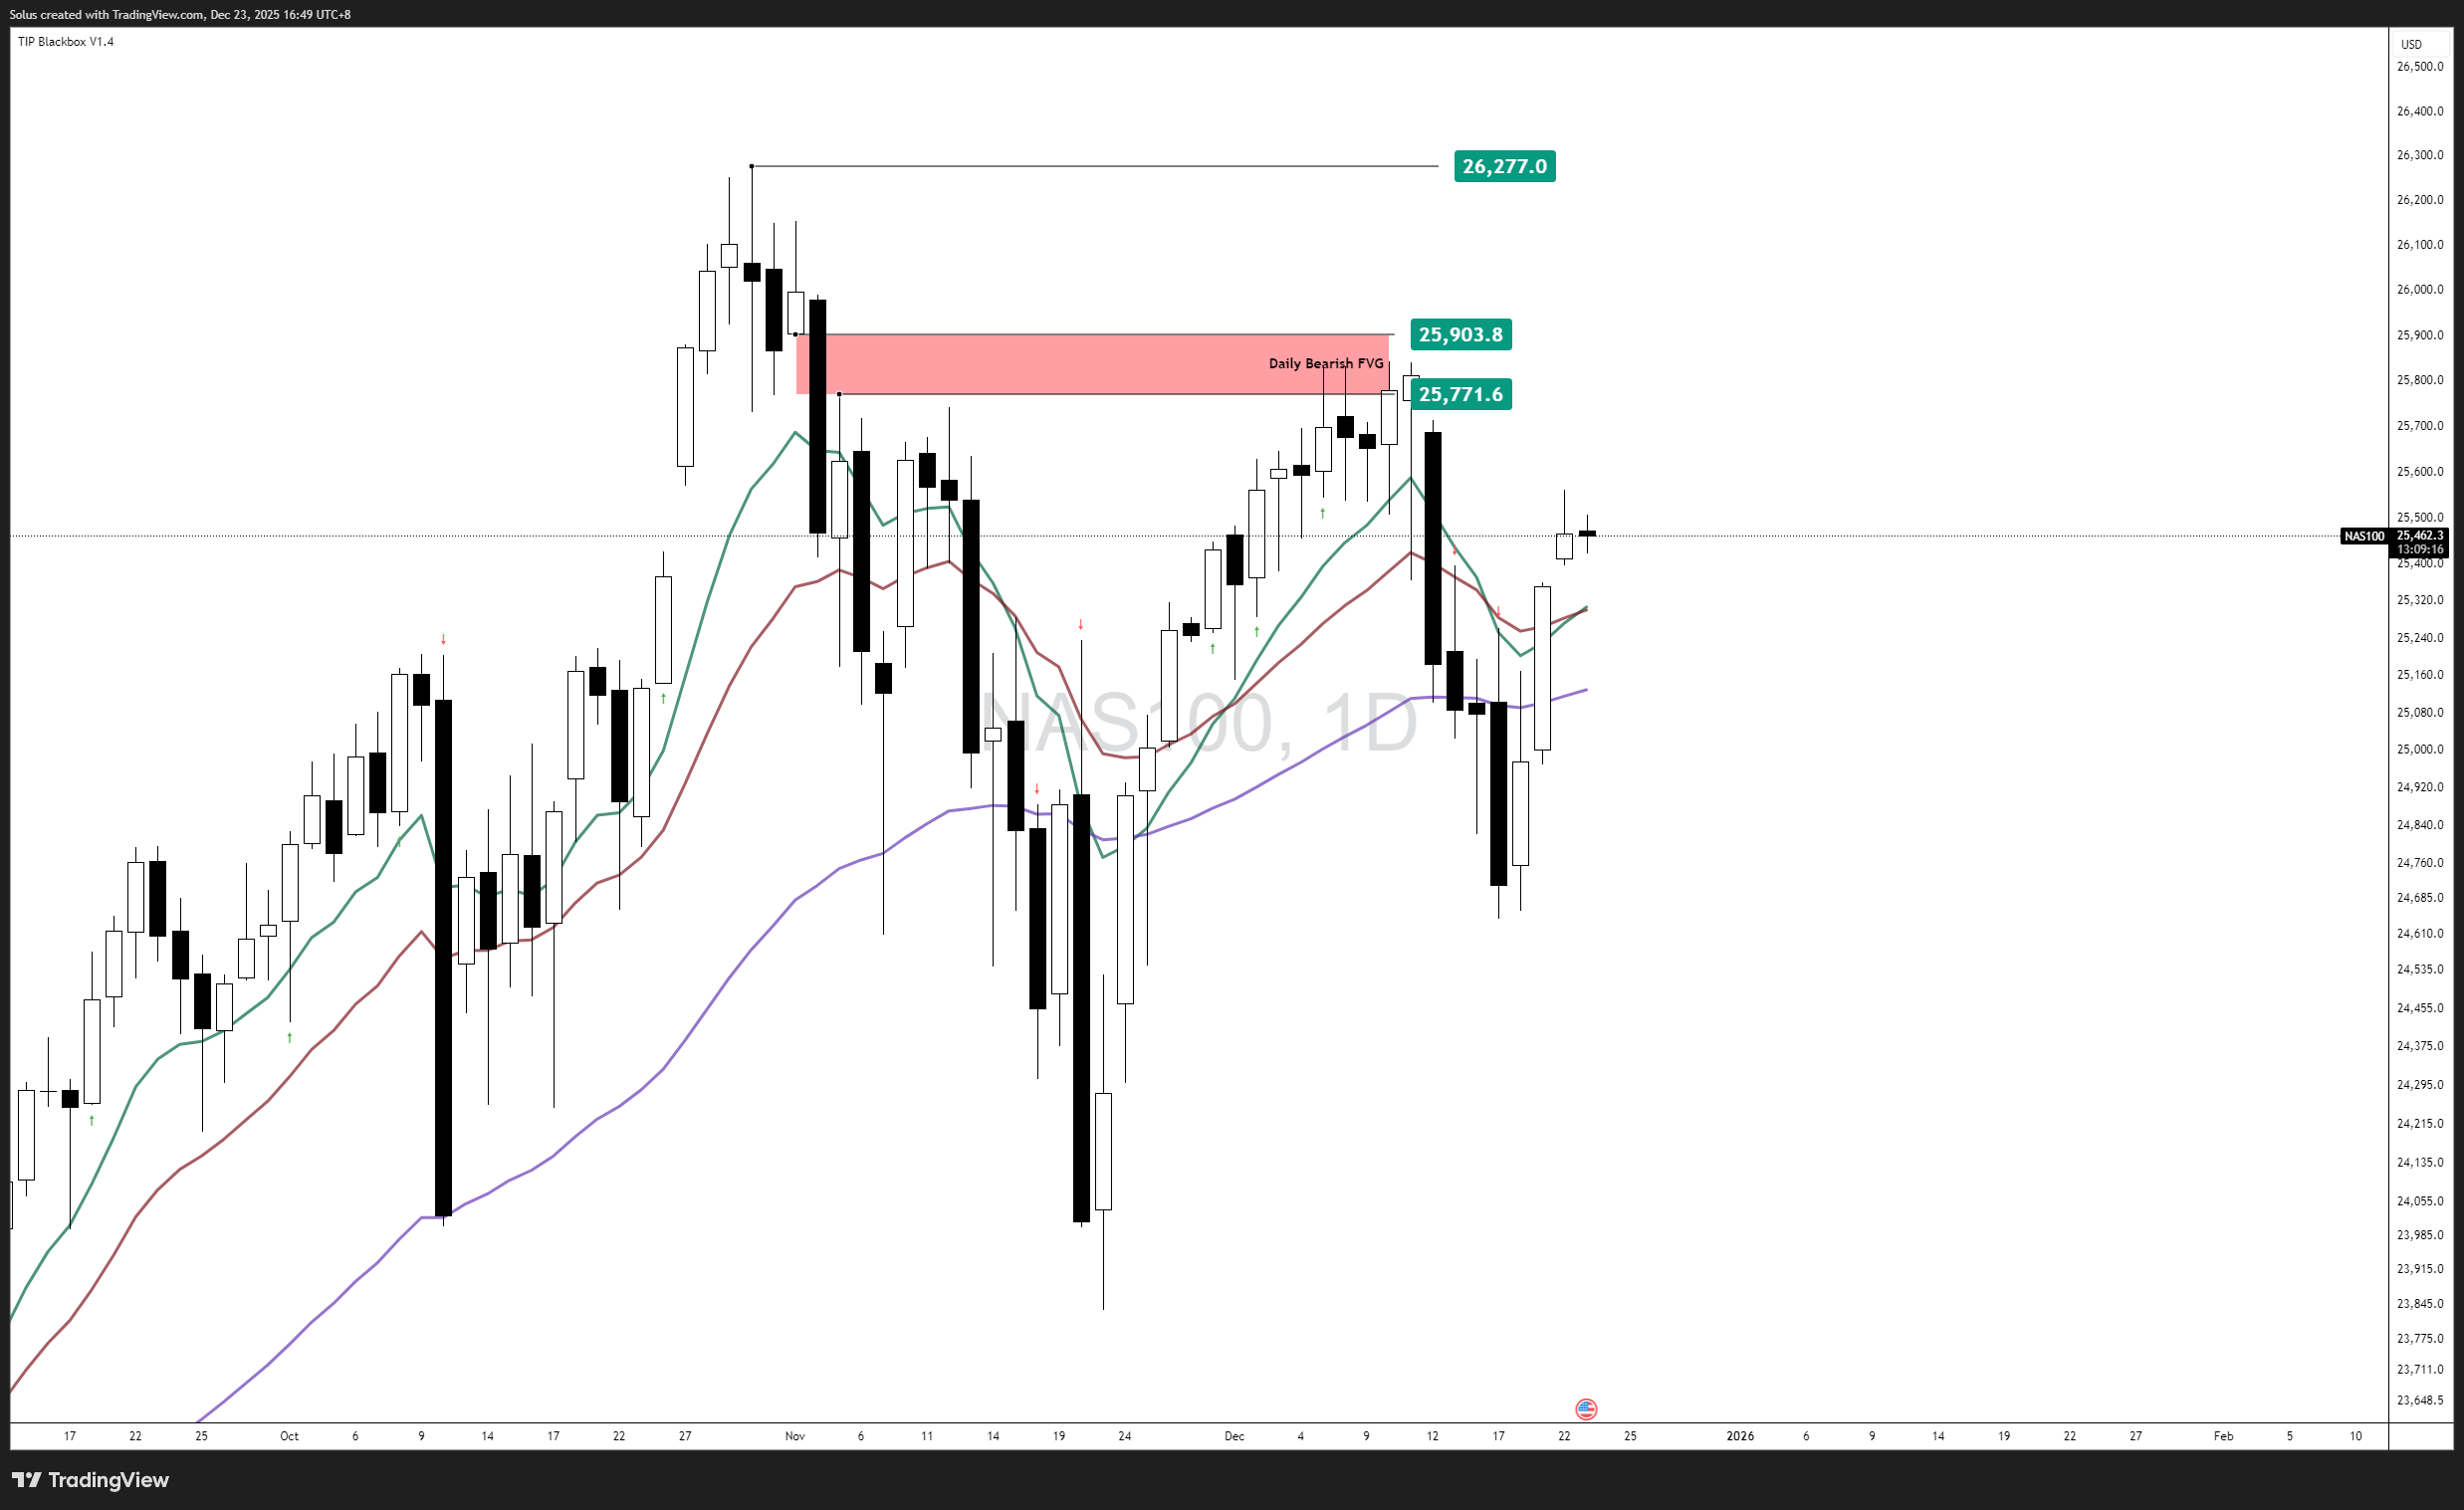
- Price remains below a Daily bearish Fair Value Gap.
- Repeated rejection near 25,900 confirms active supply.
- Structure remains corrective unless acceptance occurs above imbalance.
Intermediate timeframe (four-hour)
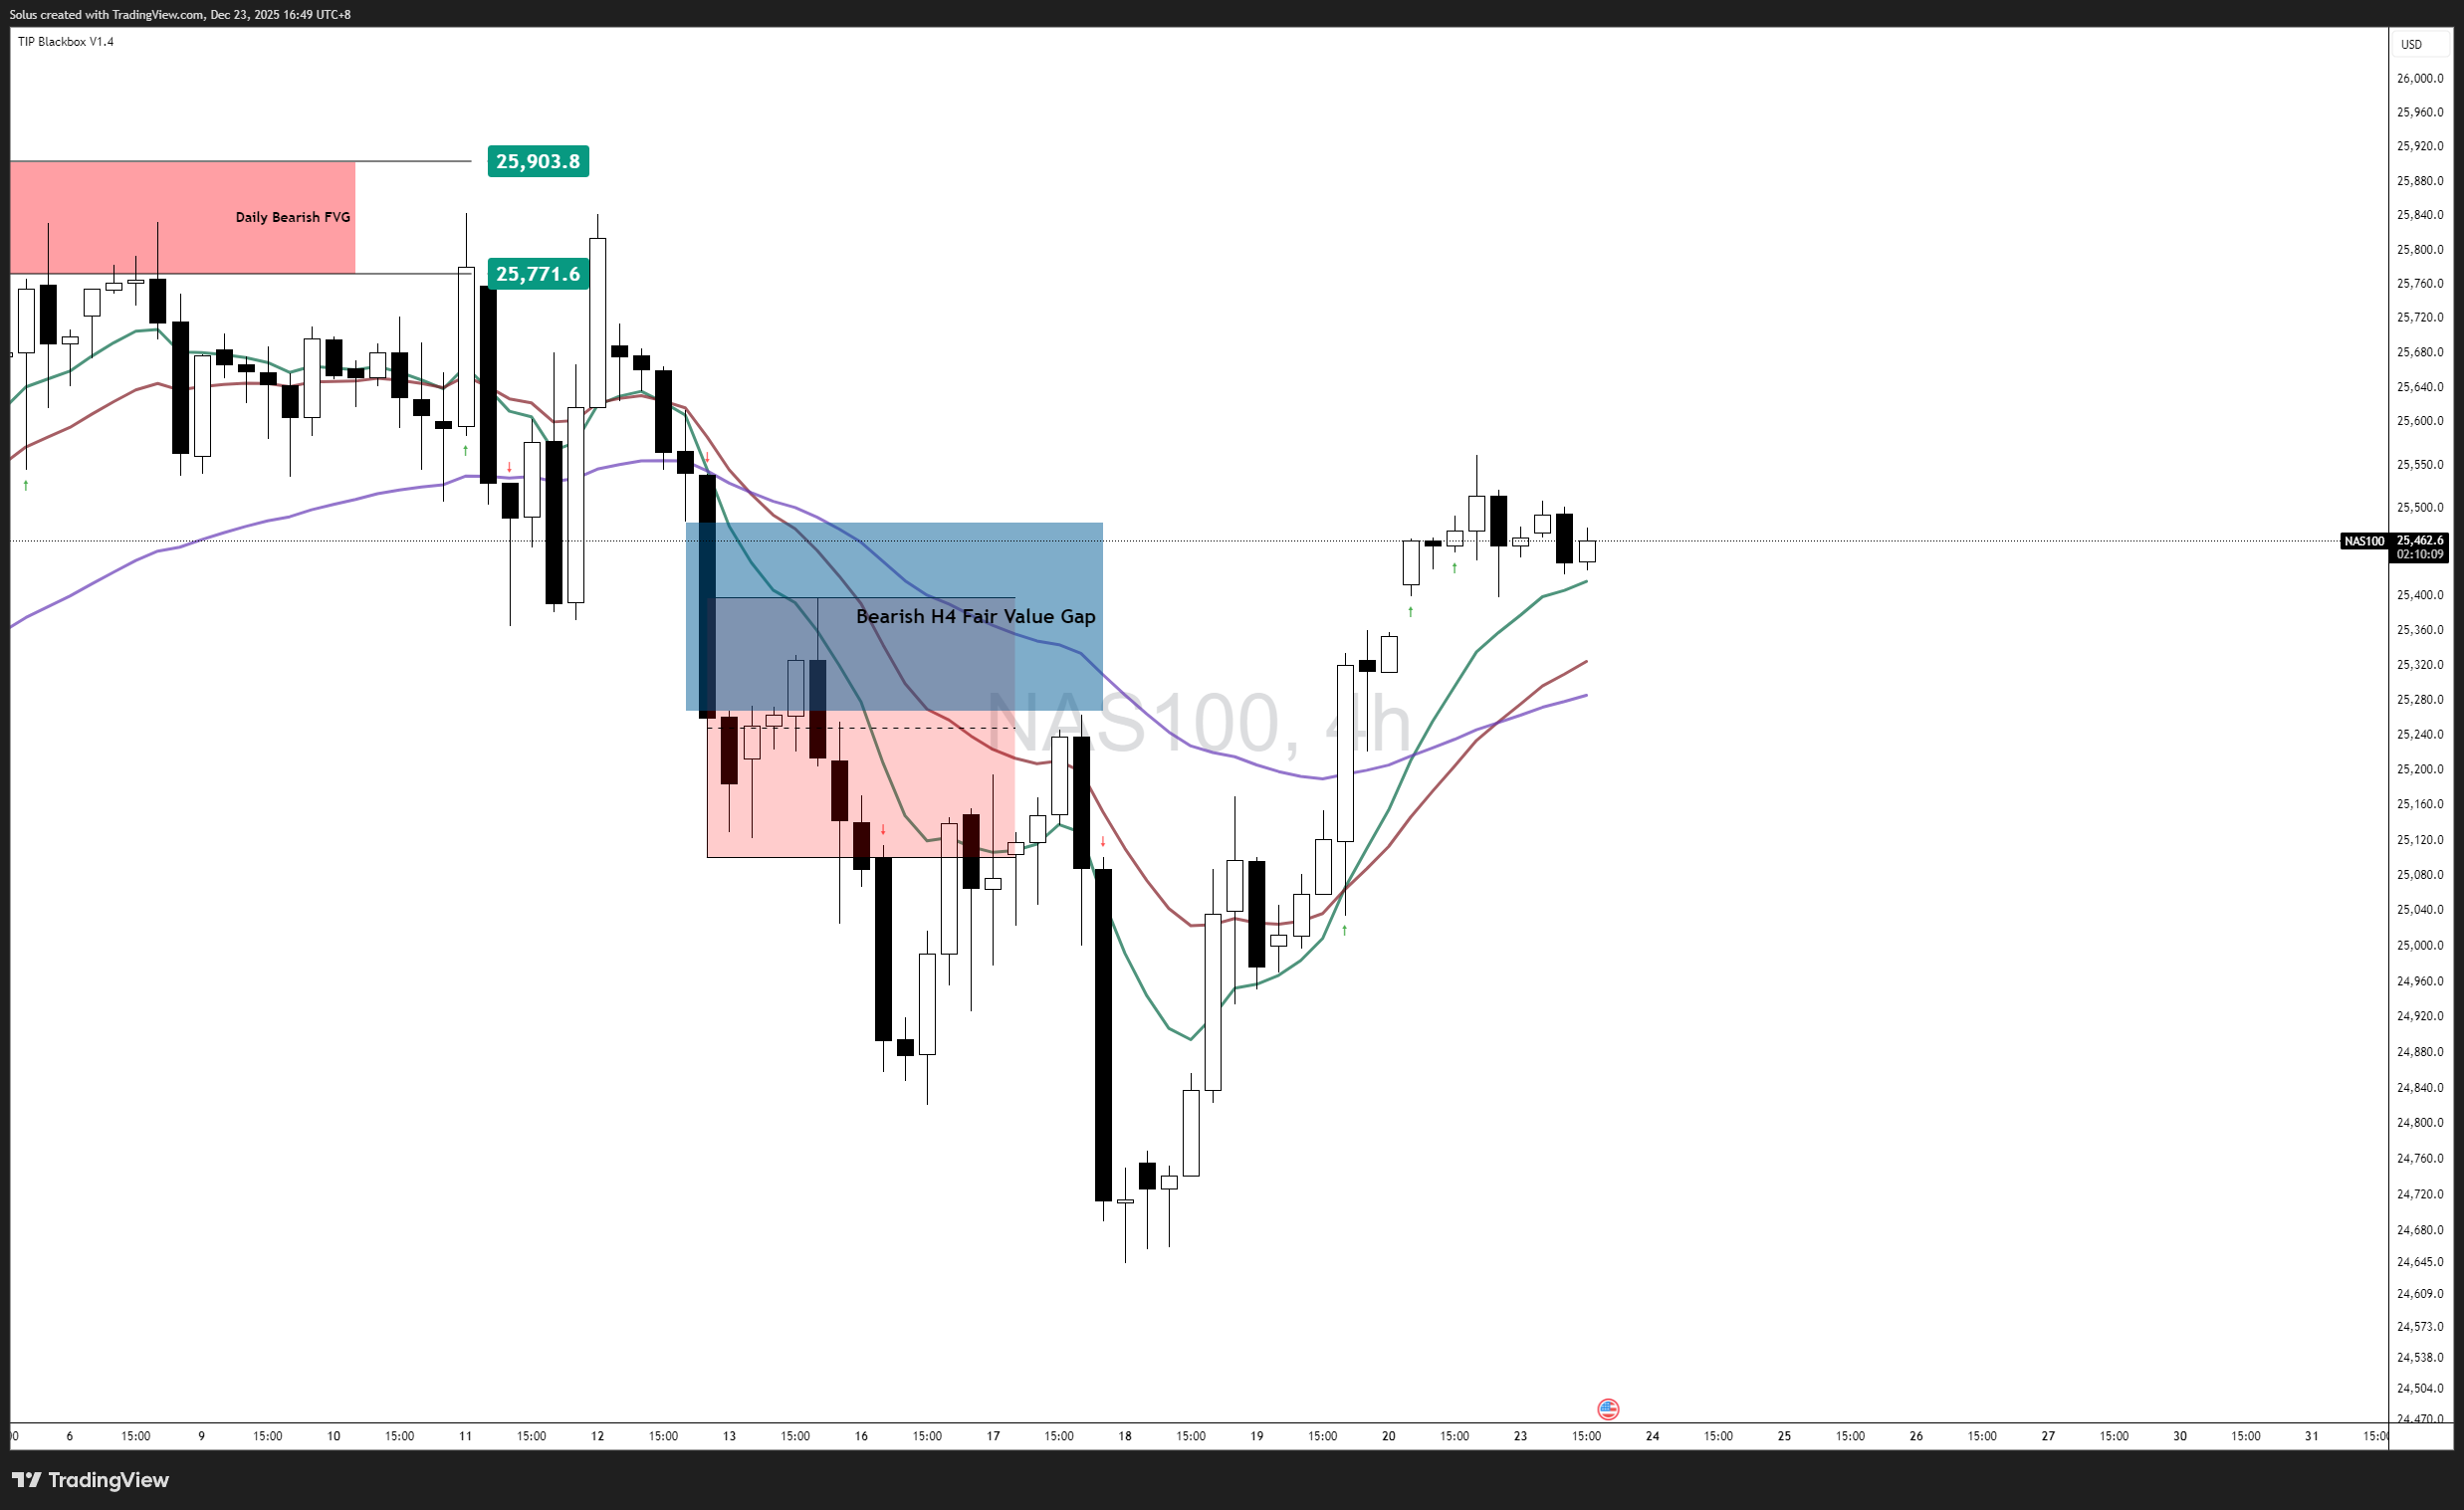
- Price rallied directly into an H4 bearish Fair Value Gap.
- Recent candles show compression and reduced displacement.
- This often precedes either:
- A pullback to rebalance, or
- A sharp breakout if supply is absorbed.
At present, absorption has not yet been confirmed.
Bullish scenario – Acceptance above supply
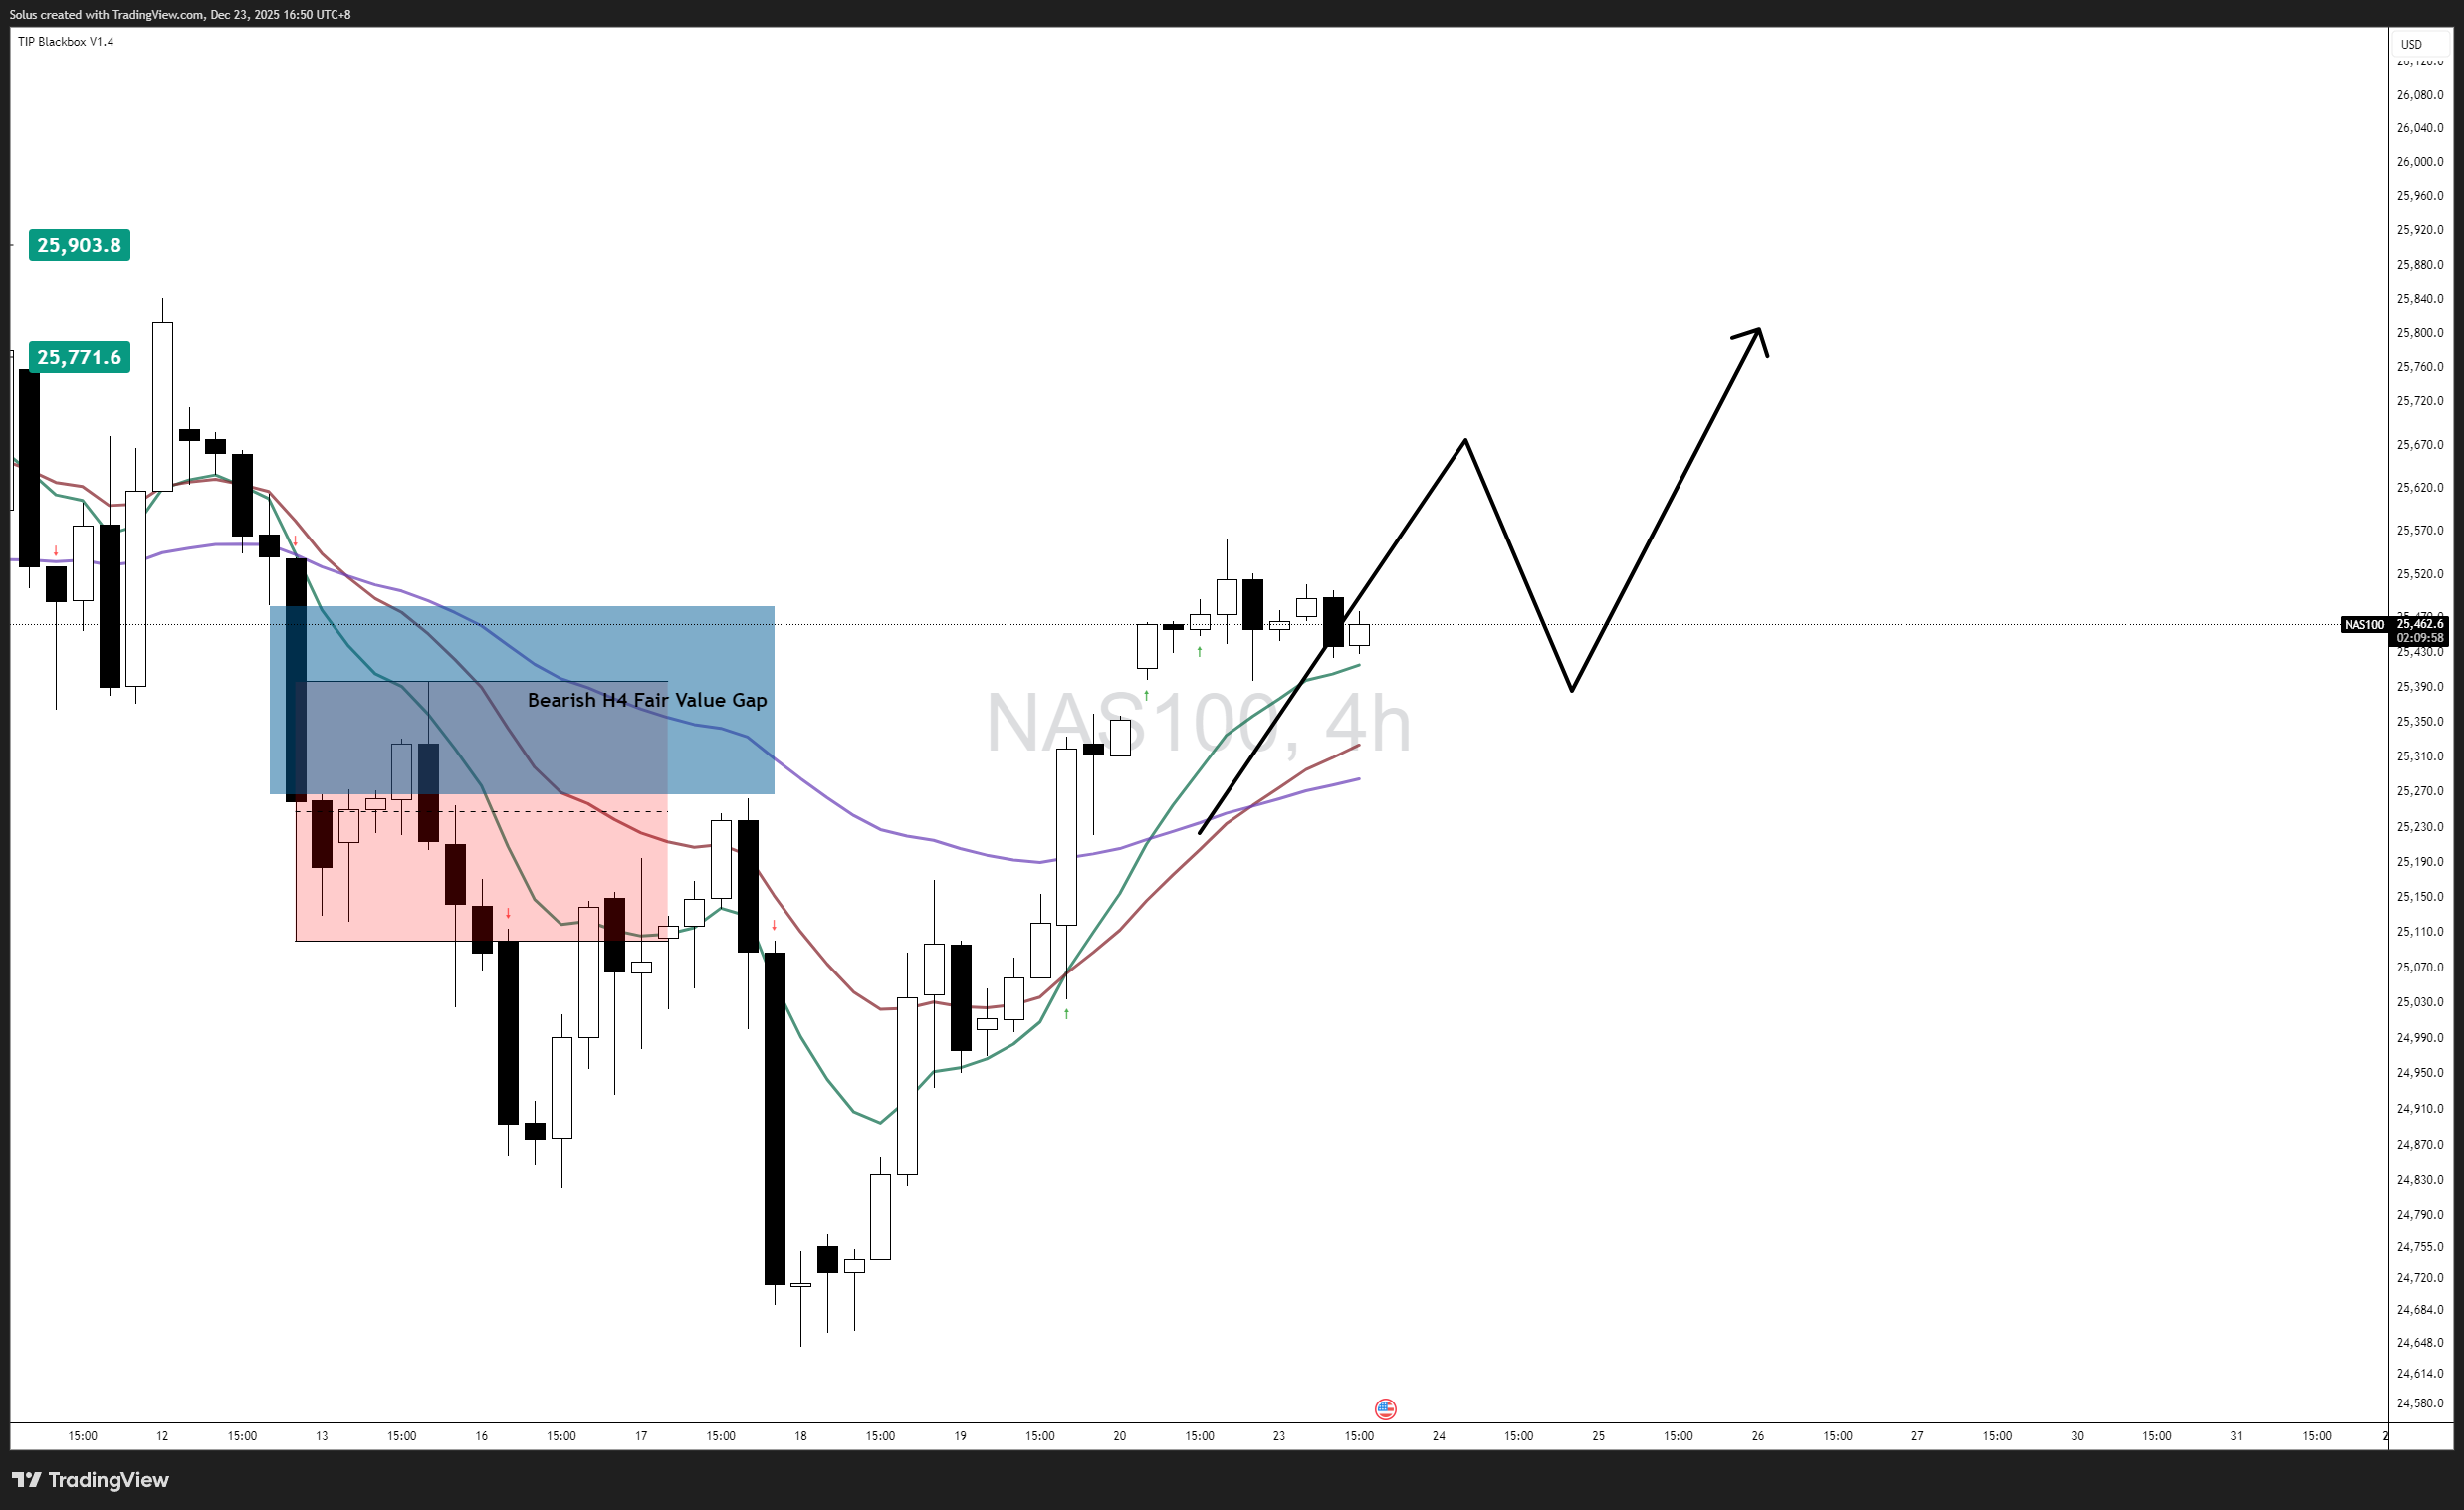
A bullish continuation requires proof, not hope.
Conditions for bullish continuation:
- Clean H4 and Daily close above 25,900
- Invalidation of the bearish FVG
- Holding structure above short-term averages
Upside targets:
- 26,100 - Liquidity draw
- 26,270-26,300 - Prior highs / extension zone
Narrative:
This scenario would signal that sellers have been absorbed and that rates are no longer actively suppressing risk appetite, opening the door to price discovery.
Bearish scenario – Rejection and mean reversion
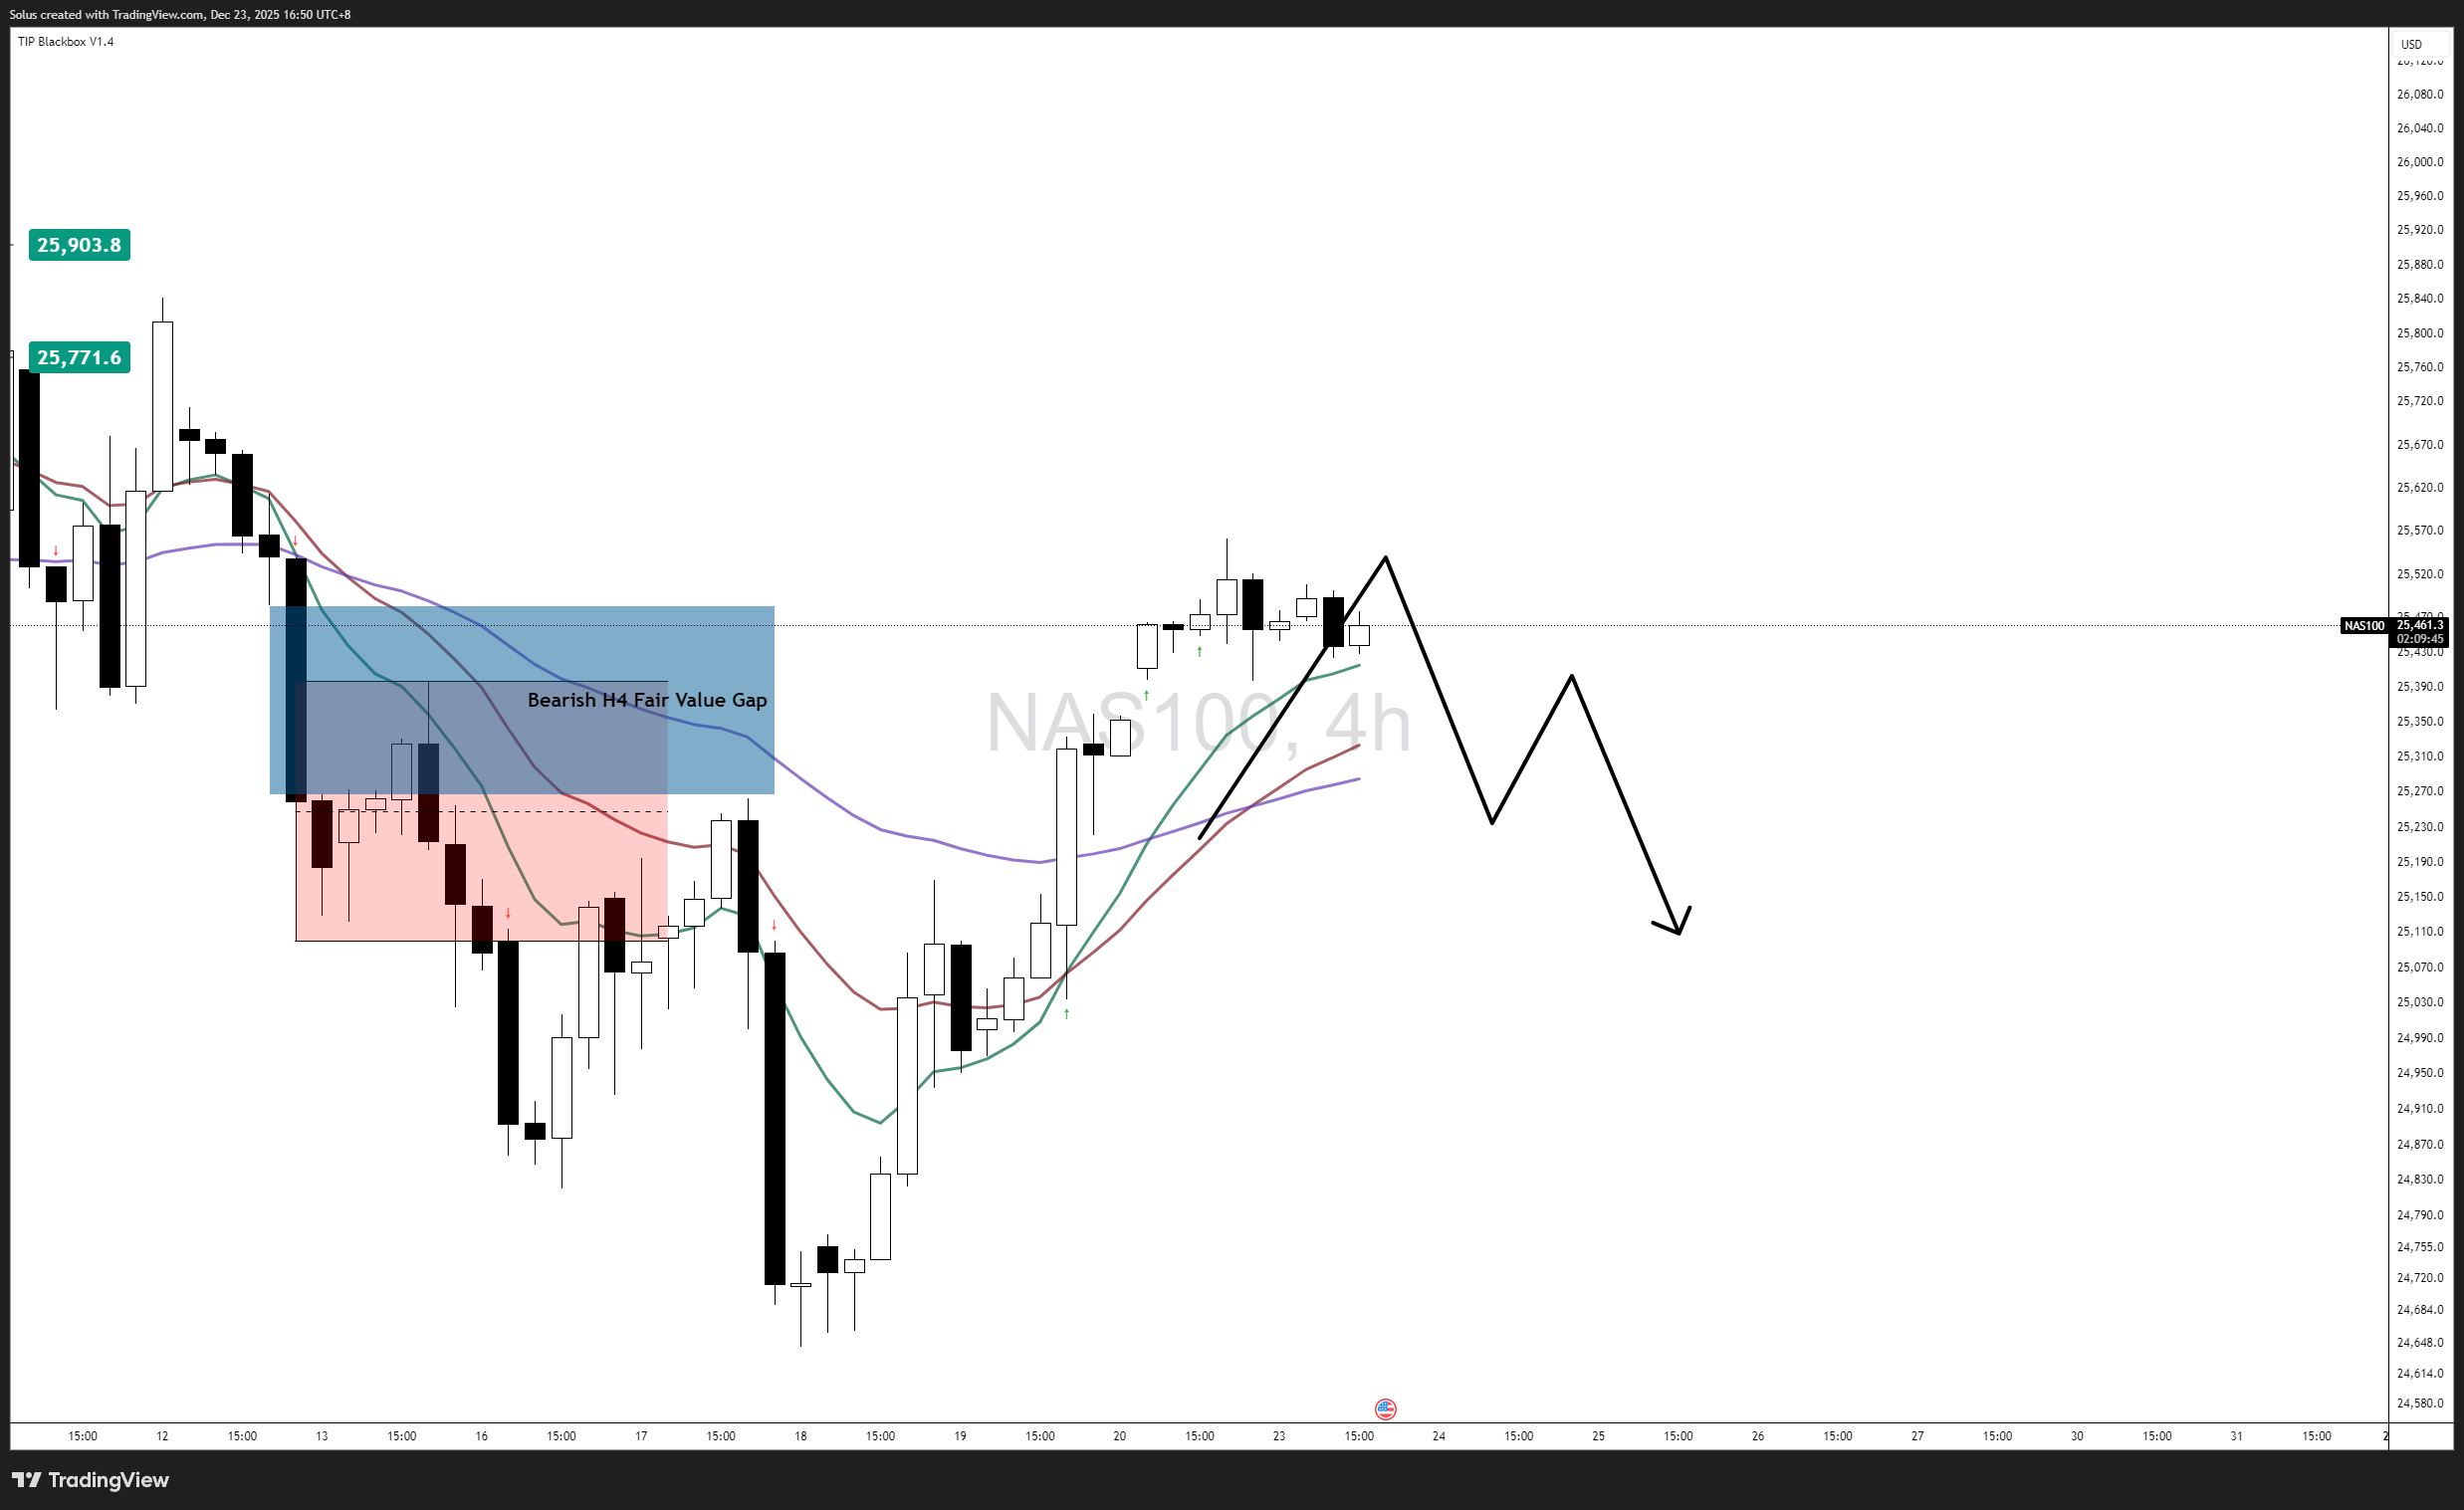
Failure to reclaim supply keeps the corrective thesis dominant.
Conditions for bearish continuation:
- Rejection wicks near 25,700-25,900
- Loss of short-term structure
- H4 close below 25,400
Downside targets:
- 25,100 - Near-term liquidity
- 24,800-24,600 - Higher-timeframe demand and equilibrium
Narrative:
This would represent a healthy reset, not a collapse—allowing price to rebalance before reassessing upside potential.
Final thoughts – Macro sets the limits, price reacts inside them
NASDAQ is not confused. It is constrained.
As long as interest rates remain elevated:
- Upside must be earned through acceptance.
- Premium zones remain selling areas.
- Pullbacks remain corrective, not bearish.
This is a conditions-based market, not a conviction-based one.
The edge lies in waiting for confirmation, not forcing bias.
Author

Jasper Osita
Independent Analyst
Jasper has been in the markets since 2019 trading currencies, indices and commodities like Gold. His approach in the market is heavily accompanied by technical analysis, trading Smart Money Concepts (SMC) with fundamentals in mind.

















