Nasdaq 100 update: Is a dip that can be bought coming?
A little over three weeks ago, we found for the NASDAQ100 by using the Elliott Wave (EW) Principle,
“… although we cannot predict or rule out any extension of the wave from the May 26 and June 23 lows, we expect the green W-3/c to finish in the next few days. Since EW analysis is based on price action, we don’t need to second-guess; instead, we can rely on our warning levels to identify when the next corrective phase—the green W-4—begins.
Fast forward, and the index exceeded the 200.00% extension target zone of 22915-23004, despite even more negative divergences (red dotted arrows). However, it did not drop below the gray (2nd) warning level for the Bulls at 22587, as the low on July 16 was 22669. See Figure 1 below. Therefore, we stayed long. Additionally, when a Fibonacci extension is exceeded, the market often moves toward the next higher level, which in this case is the green 223.60% level at 23545.
Figure 1. NDX daily chart with our preferred Elliott Wave count and several technical indicators
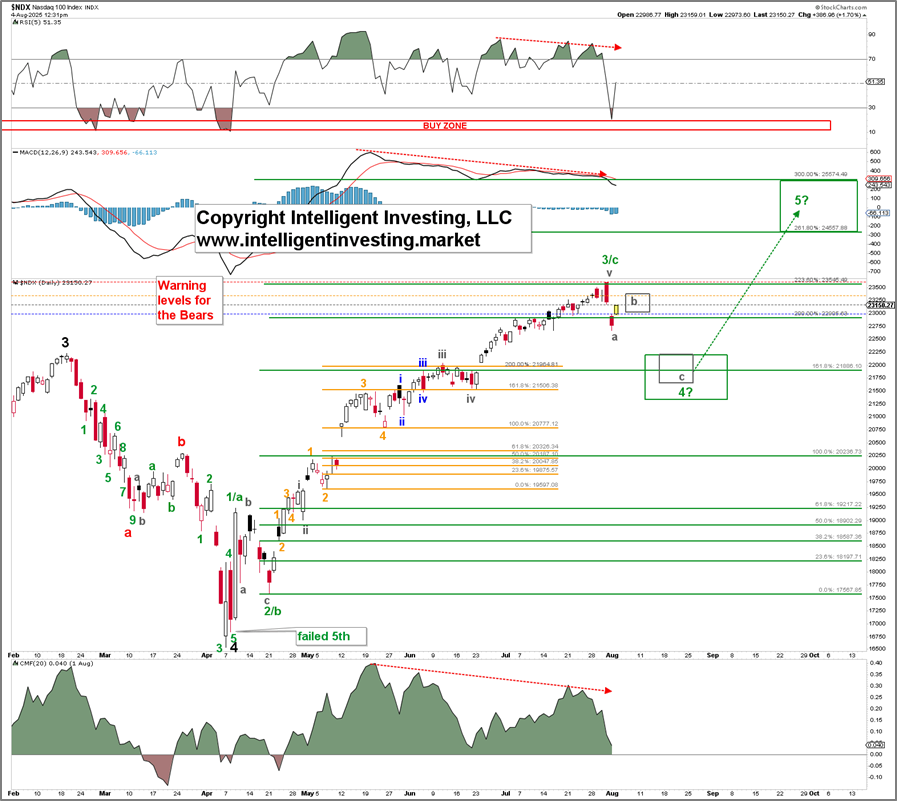
The index peaked last Thursday at 23589, just 0.19% below the green 223.6% Fib extension, and dropped to Friday’s low of 22673, falling below our previously set 3rd (orange) warning level of 22953. These warning levels increase as the index advances to help our premium newsletter members stay in the market longer, but they can also exit the market early to avoid further decline.
Since the EW is based on price and we only trade price, we must rely on price levels rather than news or opinions for market entries and exits. Our EW analysis and warning levels provide exactly that. In this case, falling below the orange warning level indicates there’s now a 75% chance that the green W-4 is underway. Corrections always move in at least three waves (abc). Therefore, Friday’s low was most likely the gray W-a of the green W-4, and now the multi-day gray W-b, to ideally 23025-380, is happening. We expect the current countertrend, also known as a “dead-cat bounce,” to be sold off.
This final W-c should reach 21650-22200, depending on where exactly W-b will top and what Fib extension the W-c will take (from 1.0 to 1.62 x W-a). Regardless, the W-c target zone is currently precisely in the ideal green W-4 target zone. Please note that the daily RSI5 is already entering the low-risk/high-reward buy zone. Once the potential green W-4 bottoms out, the subsequent green W-5 should rally to 24560-25575. Keep in mind that since the index is now likely in a corrective phase, the warning levels are for the bears. These are set at (blue) 22972, (gray) 23176, (orange) 23345, and (red) 23589. We will use these levels similarly to how we did during the past Bull run.
Figure 2. NDX McClellan Oscillator
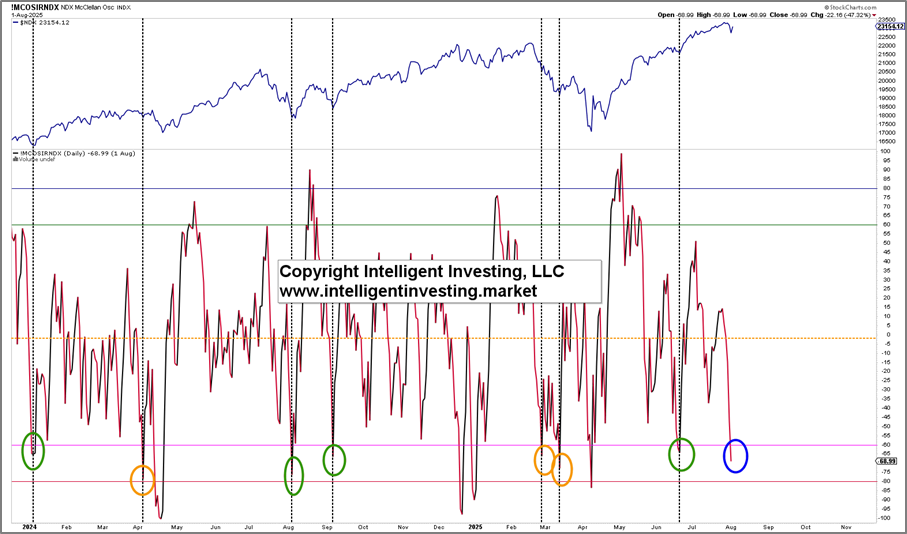
Lastly, the McClellan Oscillator for the NDX—a market breadth indicator based on the number of stocks advancing (+) or declining (-)—closed at -69 on Friday. See the blue circle in Figure 2 above. Previous daily closes between -60 and -80 since 2024 show that in four cases, a new rally started (green circles), while in three cases, it was just a bounce, followed by a lower low, and then the rally began (orange circles). Therefore, the odds favor a new rally sooner rather than later, in line with our EW count. Excluding the February-April >20% decline, the chances of a renewed rally become even more favorable.
Author

Dr. Arnout Ter Schure
Intelligent Investing, LLC
After having worked for over ten years within the field of energy and the environment, Dr.


