Nasdaq 100 overbought? Here’s what history says about the current rally [Video]
![Nasdaq 100 overbought? Here’s what history says about the current rally [Video]](https://editorial.fxstreet.com/images/Markets/Equities/Nasdaq/nasdaq-marketsite-times-square-nyc-2001-39895830.jpg)
Watch the free-preview video below extracted from the WLGC session before the market opens on 25 Jun 2024 to find out the following:
-
What it means for the Nasdaq 100 to be in an extremely overbought condition and how to identify these levels.
-
How the current Nasdaq 100 rally compare to previous rallies in terms of momentum, volume, and duration?
-
Key indicators that signal potential pullbacks or reversals in the market, and what traders should look out for.
-
What historical patterns can traders look for to anticipate the next move in the Nasdaq 100.
-
And a lot more…
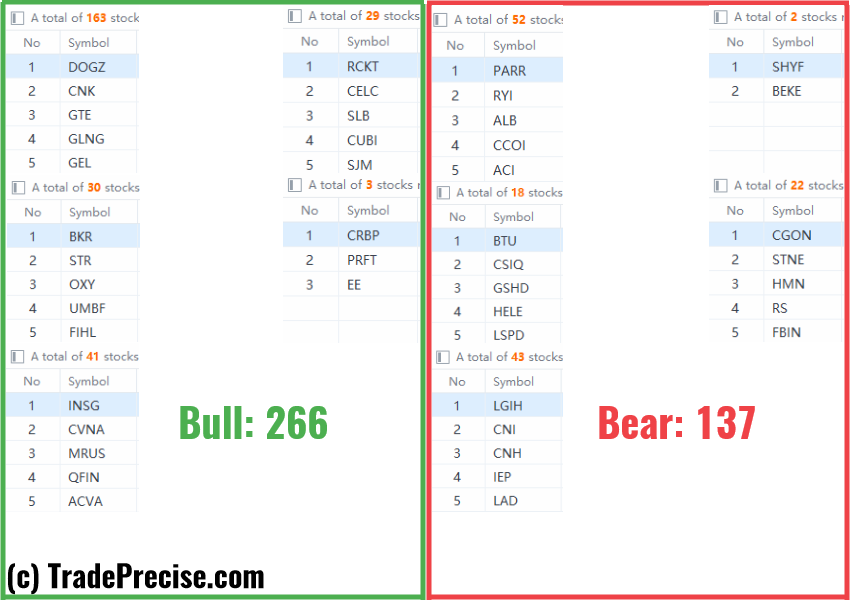
Market environment
The bullish vs. bearish setup is 266 to 137 from the screenshot of my stock screener below.
Heavy profit-taking was spotted on 20 Jun 2024 in Nasdaq 100, especially the semiconductor industry group SMH as posted last week in the latest Substack Note:
Despite the pullback in Nasdaq 100 and the S&P 500, the number of bullish setups increased.
This is further confirmed by the short-term market breadth, indicating potential rotation from the technology heavyweights into Dow Jones and Russell 2000.
Three stocks ready to soar
10 “low-hanging fruits” TGTX, HIG trade entries setups + 14 actionable setups MMYT were discussed during the live session before the market open (BMO).
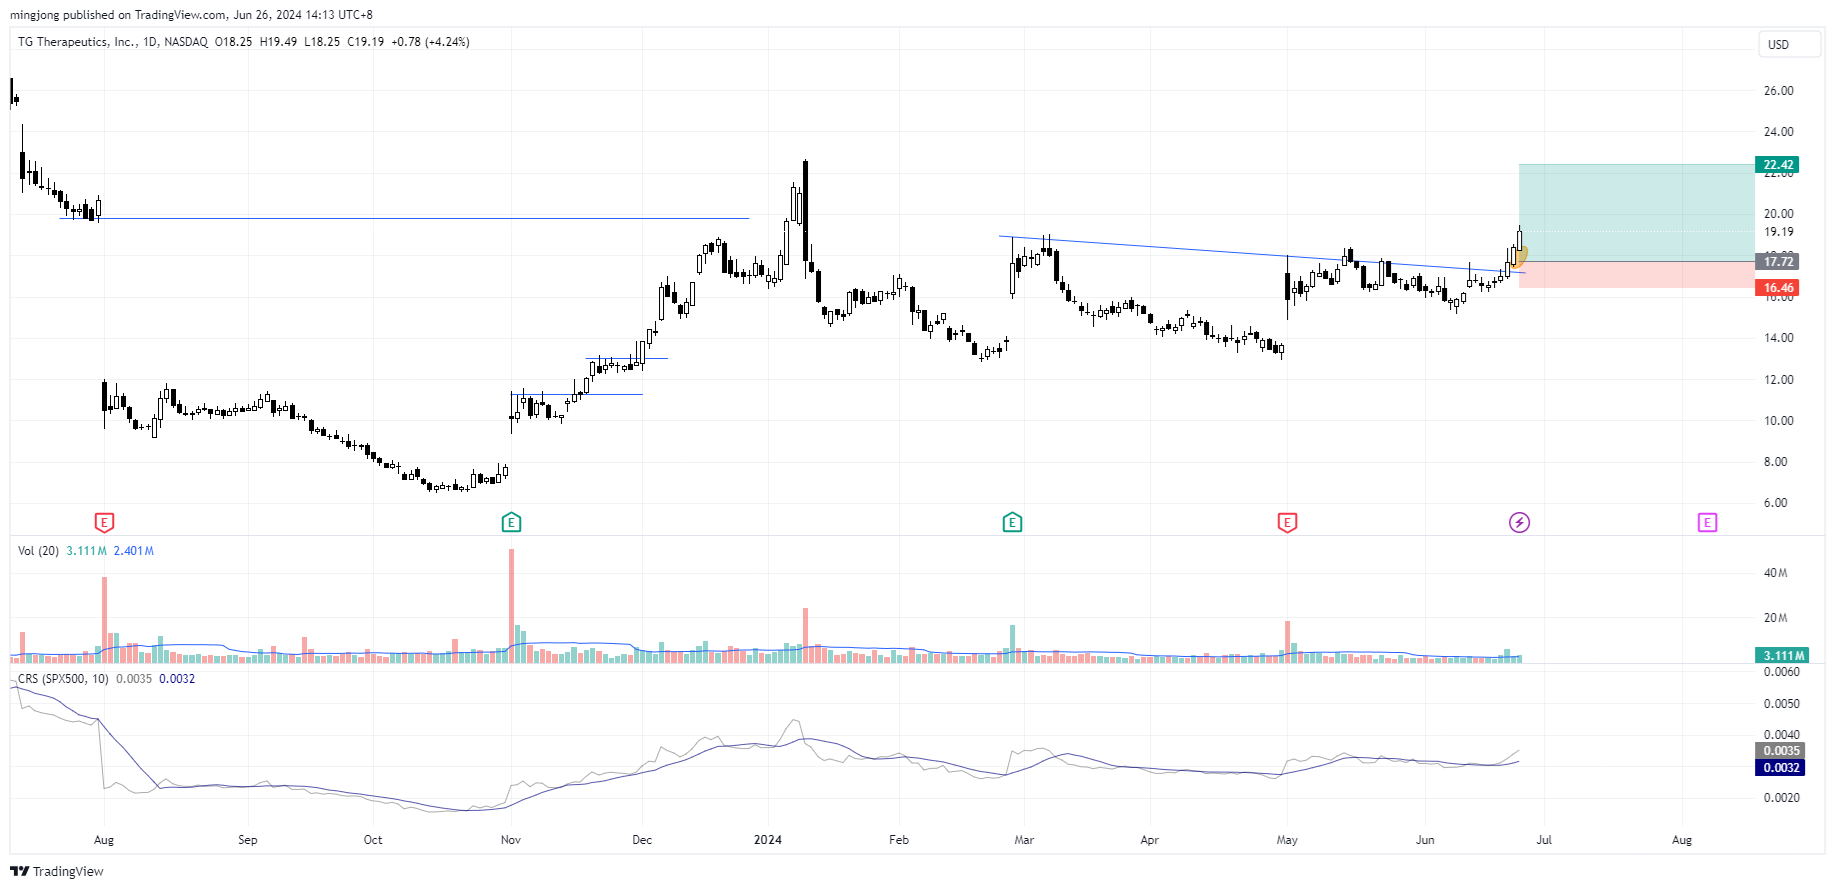
TGTX
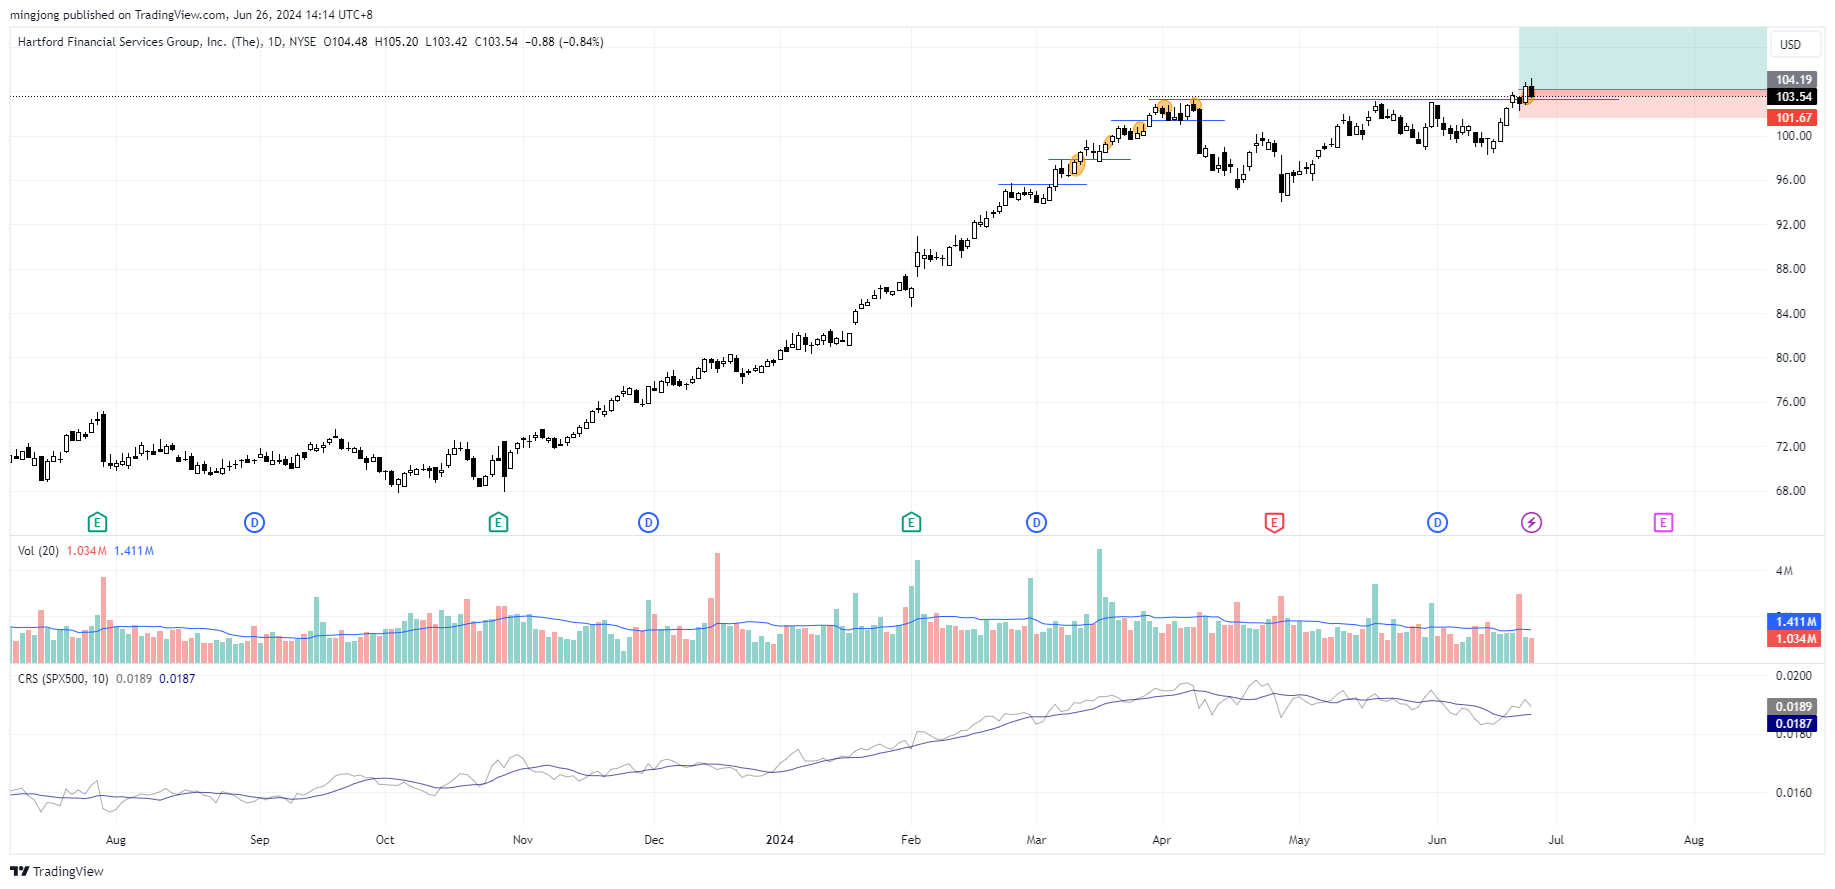
HIG
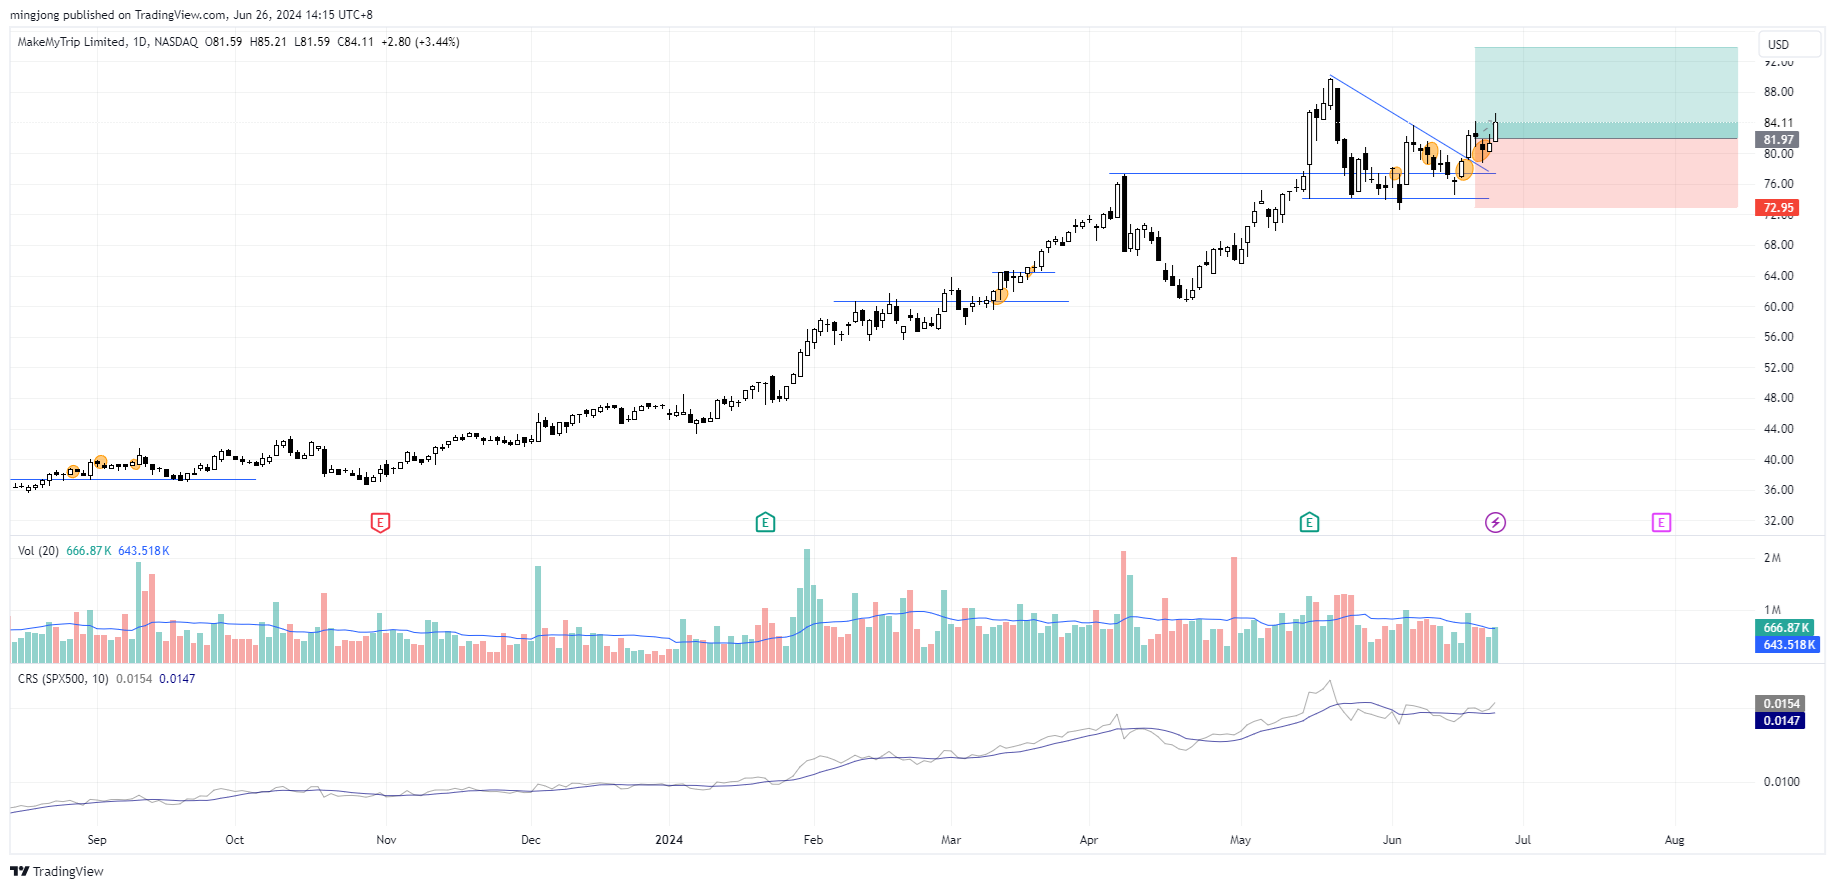
MMYT
Author

Ming Jong Tey
Independent Analyst
Ming Jong Tey has been trading since 2008. He started his learning journey from technical analysis (indicators, Fibonacci, etc...) to value investing. Throughout his journey, he develops an interest in price action with chart pattern trading.