Fibonacci extensions anchored from 1988 continue to influence price today

The weekly chart of Mosaic Company (MOS) reveals an important technical development just as the company heads into its earnings report.
Mosaic has been in a prolonged downtrend since its April 2022 high, but the price action shows signs of life just ahead of this week’s earnings report.
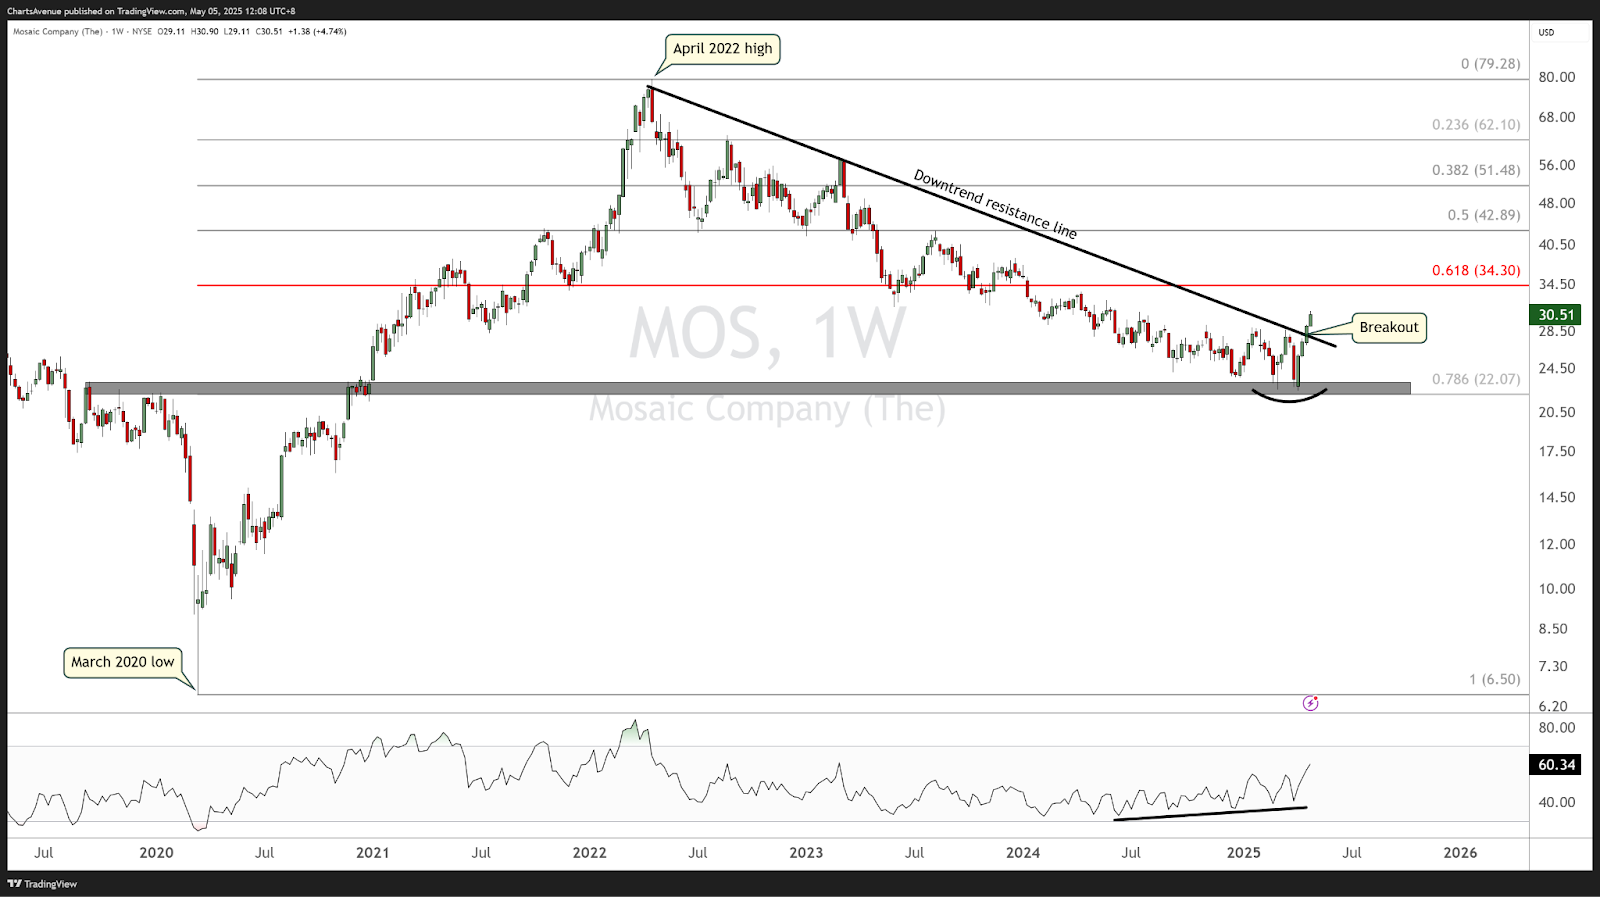
The chart shows that MOS recently bounced near the 78.6% Fibonacci retracement of its March 2020 to April 2022 rally, around $22. This bounce was significant as it pushed the price above its long standing downtrend resistance line.
Interestingly, while price made lower lows during this recent leg down, the Relative Strength Index (RSI) formed higher lows since July 2024, creating a bullish divergence. This signals weakening downside momentum and possibly a reversal of the current (down-)trend.
Bottom Line: The breakout above the downtrend line, combined with bullish divergence on the RSI, hints at a potential trend shift. However, the upcoming earnings could be a key catalyst that determines whether this breakout holds or fails.
Kroger shows how 1988 still matters
The monthly chart of Kroger (KR) reveals a remarkable long-term pattern where price levels from 1988 continue to guide today’s market price action.
The October 1988 high and December 1988 low provide the base for the Fibonacci extension levels plotted on the chart. Fast-forward nearly four decades, and KR has now hit its 11.09 Fibonacci extension target around $71, underscoring how long-term technical analysis can remain relevant.
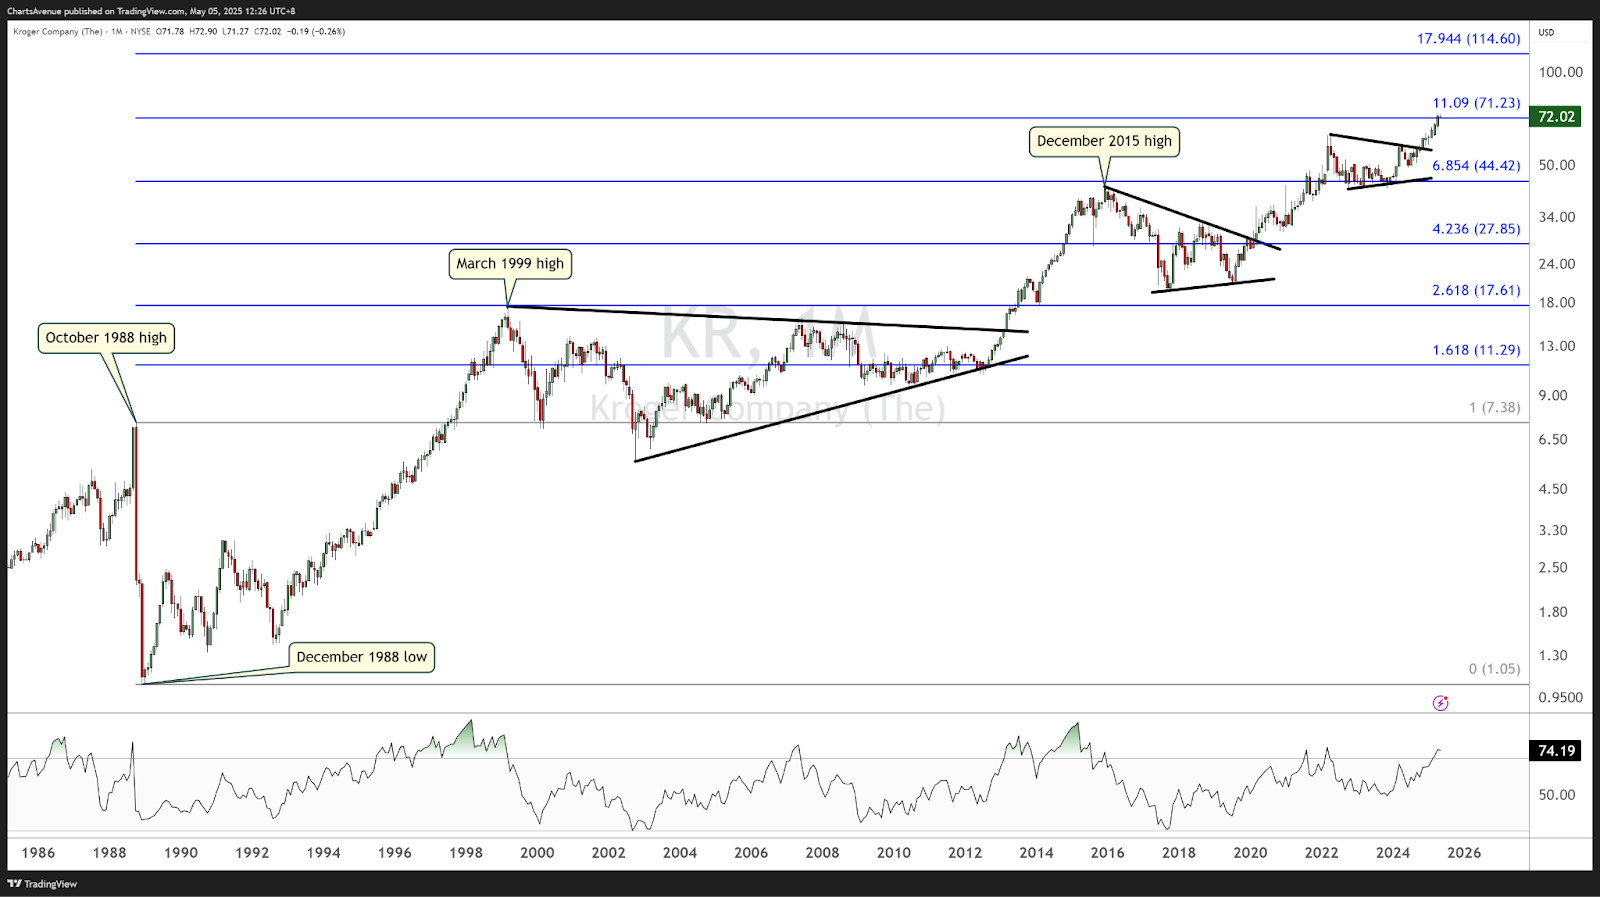
One can also notice how Kroger repeatedly formed the same type of consolidation pattern below key highs (notably in March 1999 and December 2015).Currently, as the RSI has not yet risen to overbought territory (above 70) the price might still have momentum to continue its uptrend towards its next Fibonacci level.
CNP’s rally stretches: Time for a pullback?
The daily chart of CenterPoint Energy (CNP) shows a strong and accelerating uptrend. CNP first broke above its 200-day Exponential Moving Average (EMA) in Q4 2024, a classic bullish signal. Since then, the price bounced off first on its 200-day EMA, then, on its next pullback hugged its 100-day EMA, followed by the next retracement towards its 50-day EMA and finally on its 21-day EMA, showing that the accumulation is intensifying.
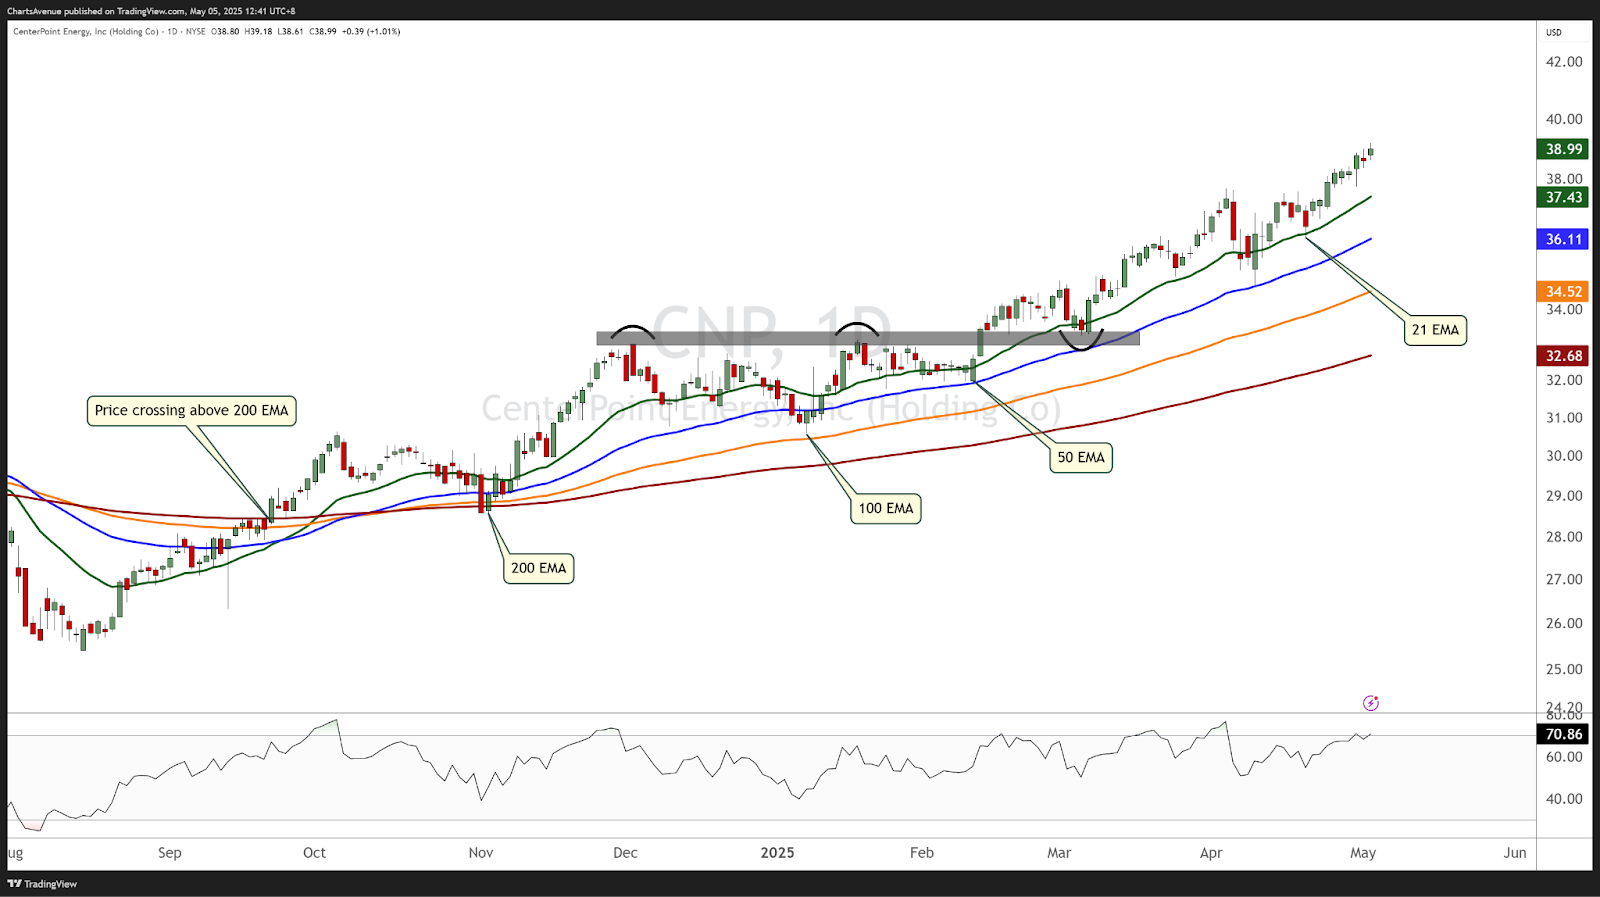
However, the trend may be getting overheated. Historically, steep trends often pause or pull back to digest gains before resuming higher.
Conclusion:
CNP’s trend remains decisively bullish, supported by the alignment of the 21, 50, 100, and 200 EMAs, stacked from top to bottom, which is textbook bullish. But with the current price getting away from its closest Exponential Moving Average, and each EMA getting further from each other, i.e. accelerating uptrend, one may consider waiting for a pullback, ideally towards the 21 or 50 EMA area, before entering a new long position.
Unlock exclusive gold and silver trading signals and updates that most investors don’t see. Join our free newsletter now!
Unlock exclusive gold and silver trading signals and updates that most investors don’t see. Join our free newsletter now!
Author

CMT Association Research Team
CMT Association
The CMT Association is a global credentialing body that has served the financial industry for nearly 50 years.


