|

Microsoft (MSFT) looking for zigzag pullback [Video]

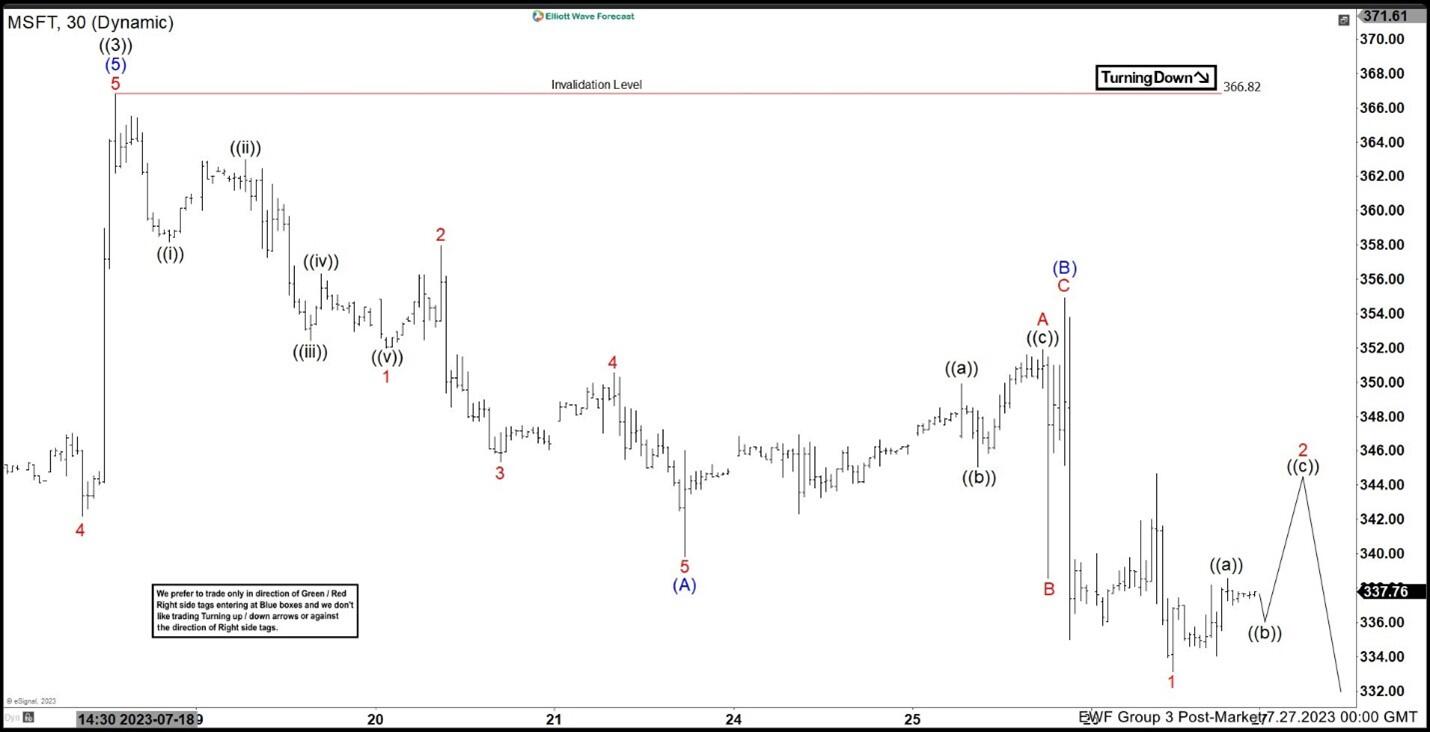
Rally in Microsoft (ticker: MSFT) from the 11.4.2022 low is unfolding as a 5 waves impulse Elliott Wave structure. Up from 11.4.2022 low, wave ((1)) ended at 263.92 and pullback in wave ((2)) ended at 219.35. The stock rallies again in wave ((3)) which ended at 366.82 as the 30 minutes chart below shows. Wave ((4)) pullback is currently in progress as a zigzag Elliott Wave structure. Down from wave ((3)), wave 1 ended at 352.01 and rally in wave 2 ended at 357.97. The stock resumes lower in wave 3 towards 345.37 and wave 4 ended at 350.56. Final leg wave 5 ended at 339.83 which completed wave (A).

Rally in wave (B) ended at 354.9 with internal subdivision as an expanded flat. Up from wave (A), wave ((a)) ended at 349.9, wave ((b)) ended at 345.07, and wave ((c)) ended at 351.89. This completed wave A of (B) in higher degree. Pullback in wave B ended at 338.56 and rally in wave C ended at 354.90 which completed wave (B). The stock now has resumed lower in wave (C). Down from wave (B), wave 1 ended at 333.11. Wave 2 rally is in progress as a zigzag to correct the decline from wave (B). Expect wave 2 rally to fail below wave (B) high at 354.9 and the stock to reesume lower. As far as pivot at 366.82 high stays intact, rally should fail in 3, 7, or 11 swing for further downside.

MSFT 30 minutes Elliott Wave chart
MSFT Elliott Wave video

Author

Elliott Wave Forecast Team

Elliott Wave Forecast Team

ElliottWave-Forecast.com

More from Elliott Wave Forecast Team
Share:

Editor's Picks

AUD/USD climbs toward 0.7000 after strong China data dump

AUD/USD attracts follow-through buyers for the second straight day on Monday, extending last week's recovery toward 0.7000 in Monday's Asian trading. Strong Chniese Q3 GDP and activity data for September strengthen the pair's advance, following RBA Assistant Governor Chris Kent's hawkish remarks.

USD/JPY struggles near 158.00 amid hawkish BoJ, subdued USD

USD/JPY remains defensive near 158.00 in the Asian session on Monday, as the US Dollar remains depressed near a two-week low amid the recent decline in US bond yields. Furthermore, looming intervention risks underpin the Japanese Yen and weigh on the pair amid BoJ Governor Kazuo Ueda's hawkish remarks. However, Fed rate-hike bets and geopolitical uncertainties could limit USD losses and the major.

Gold stalls below $4,200 as Fed rate-hike bets limit upside

Gold (XAU/USD) struggles after opening the week higher. The US Dollar (USD) and US Treasury yields find some footing following last week’s pullback as traders assess the Federal Reserve’s (Fed) interest rate path and geopolitical developments.

Crypto Today: Bitcoin, Ethereum, XRP extend recovery despite ETFs outflows

Bitcoin edges higher above $82,000, building strong structural support despite roughly $229 million in ETF outflows last week. Ethereum recovers above $2,400 as bulls strive to regain trend control, backed by a subtle recovery in momentum indicators.

Higher than expected inflation shakes markets: What to prepare for?

US CPI report came in stronger than expected, lifting the probability of a December rate hike higher once again. Even though Fed Chair Warsh reinforced expectations of a hold for the October’s meeting, markets now face a two-step event: a likely pause on October 28, followed by an interest rate hike on December 9.

Everyone's dumping Gold after hot US inflation. Here's why $4,100 could be a floor, not a cliff
Gold (XAU/USD) is recovering from a sharp sell-off triggered by hotter-than-expected United States (US) inflation data released on Wednesday. The precious metal briefly plunged toward $4,073 as investors increased their bets on further Federal Reserve (Fed) interest rate hikes before recovering as US Treasury yields and the US Dollar (USD) reversed their initial gains.