|

Microsoft Corp ($MSFT) reacts higher from the blue box area

Good Day Traders and Investors. In today’s article, we will look at the past performance of the 1 Hour Elliott Wave chart of Microsoft Corp. ($MSFT) The rally from 5.24.2023 low unfolded as a 5 wave impulse with an incomplete bullish sequence from 4.25.2023 low. So, we advised members to buy the pullback in 3 swings at the blue box area ($328.38 – 323.73). We will explain the structure & forecast below:

$MSFT 1h Elliott Wave chart 6.01.2023
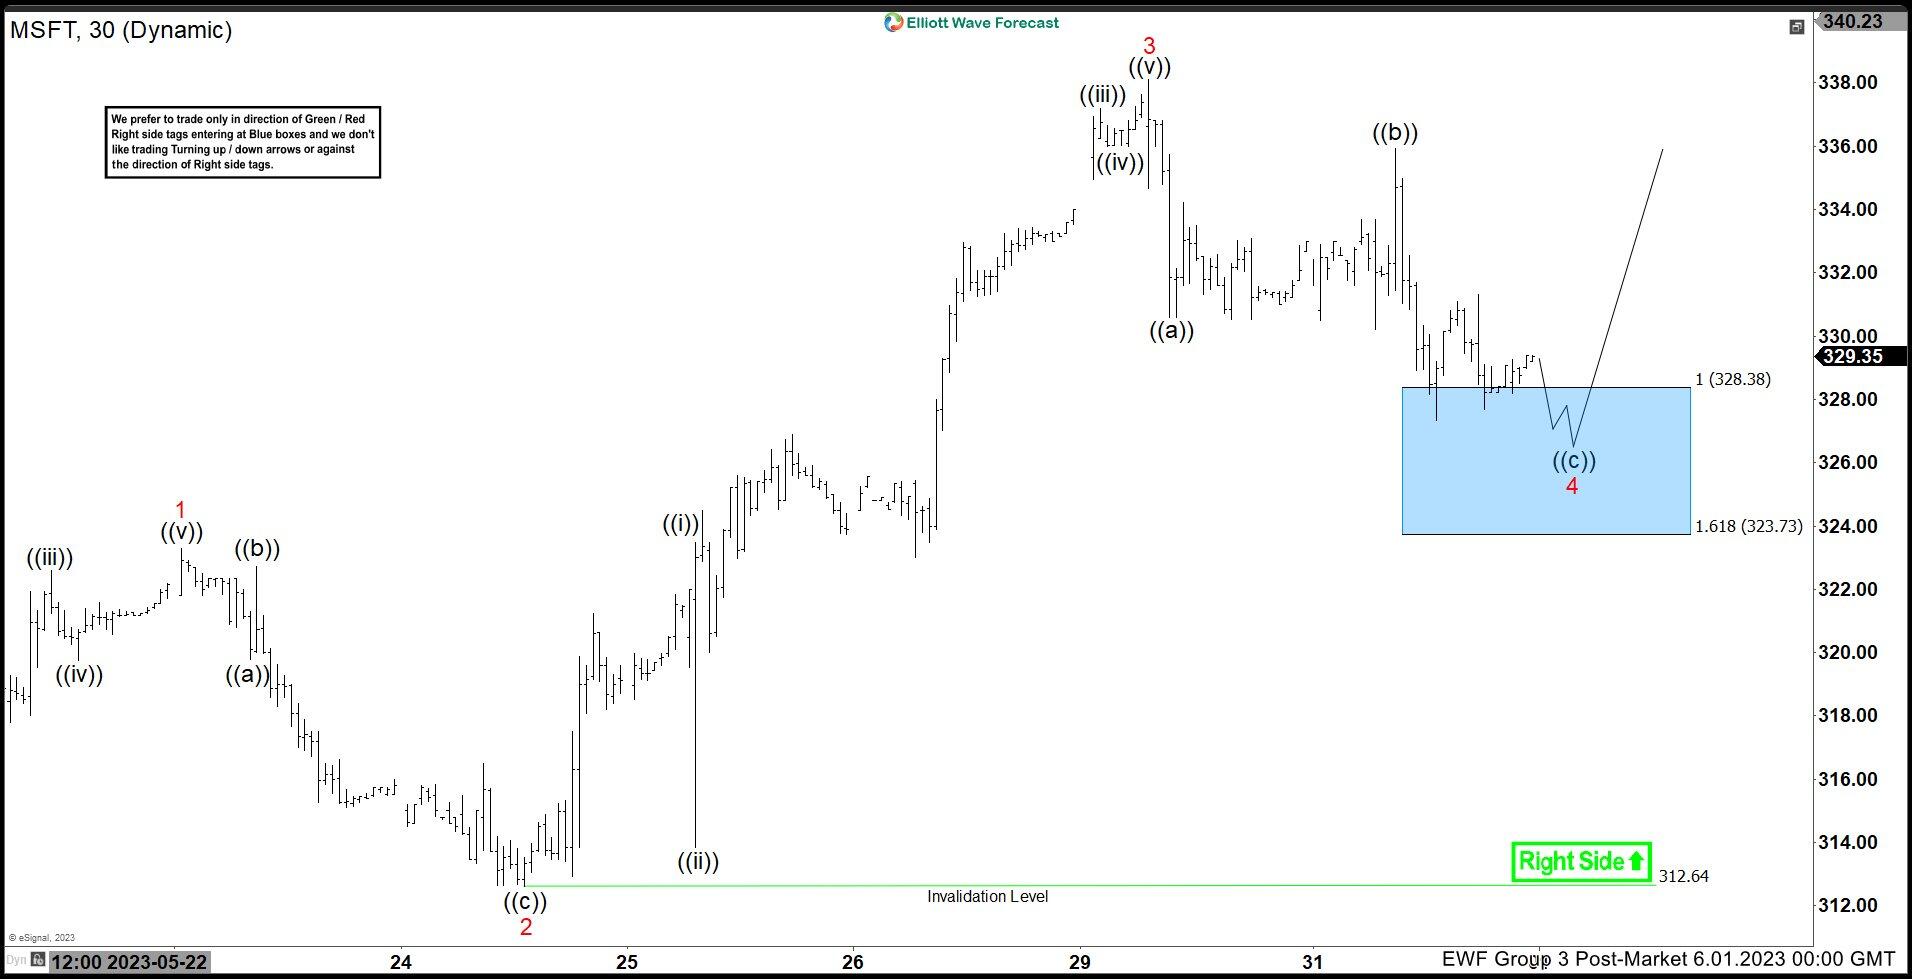
Here is the 1H Elliott Wave count from 6.01.2023. The rally from 5.24.2023 unfolded in a 5 wave impulse which signaled a bullish trend. We expected the pullback to find buyers in 3 swings at $328.38 – 323.73 where we entered as buyers.

$MSFT 1h Elliott Wave chart latest view
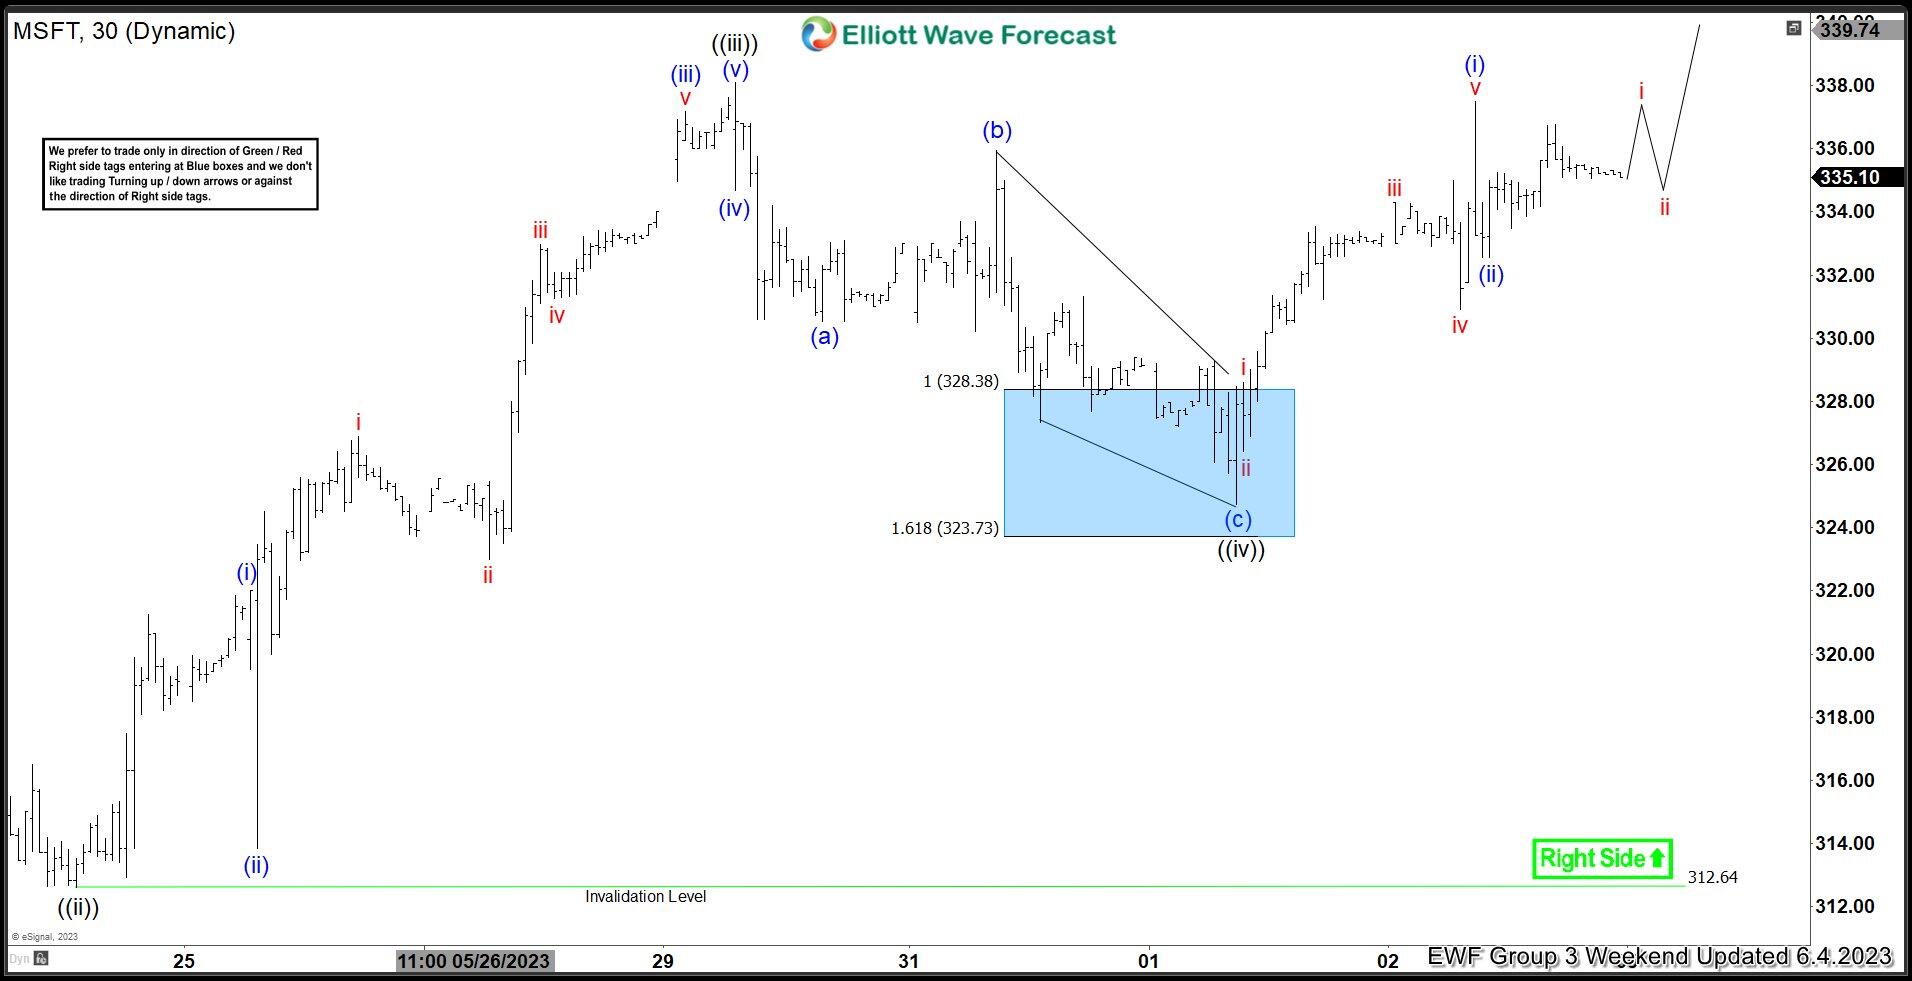
Here is the latest 1H update showing the move taking place as expected. The stock has reacted higher ending the cycle from 5.30.2023 peak and eventually breaking above it which confirms more upside is to be seen. We remain long with a risk free position targeting new all time highs and won’t be surprised to see $MSFT trading towards $380 – 435 area in the near term.

Author

Elliott Wave Forecast Team

Elliott Wave Forecast Team

ElliottWave-Forecast.com

More from Elliott Wave Forecast Team
Share:

Editor's Picks

AUD/USD holds above 0.6900 ahead of China’s trade data

AUD/USD struggles to capitalize on the previous day’s recovery move as prolonged Middle East uncertainty supports the safe-haven US Dollar. Moreover, Fed hike bets provide a tailwind for the buck, while expectations of a cautious, on-hold RBA stance cap the Aussie. Spot prices, however, hold above 0.6900 as traders look to China’s trade data and the US CPI report for a fresh impetus.

USD/JPY retreat in sync with USD, appraches 158.00

USD/JPY is back in the red at the start of the week on Monday, eyeing the broad US Dollar retreat amid easing US-Iran tensions. Traders also resorting to profit-taking following the blockbuster US Nonfarm Payrolls data-led rally. US CPI report is next in focus.

Gold keeps the bid tone near $4,100

Gold resumes its recovery on Monday, hovering around the $4,100 region per troy ounce. The precious metal’s solid performance comes amid fresh downside pressure on the US Dollar, rising US Treasury yields and a marked retracement in crude oil prices.

NYSE taps Avalanche for clearing and settlement of tokenized securities

Avalanche defied the crypto market drawdown on Monday, up 4% after announcing it will provide the core ledger technology for clearing in the New York Stock Exchange's upcoming tokenized securities trading platform.

US CPI preview: Moderation on the horizon, but underlying pressures linger
The US Consumer Price Index for October will be released on Tuesday, November 10, at a time when financial markets are receiving rather different signals from inflation, employment and credit conditions. September's inflation report showed headline consumer prices rising by 0.6% month over month, while core inflation increased by 0.3%.
Gold reclaimed $4,100. Tuesday’s CPI test decides if it holds
Gold (XAU/USD) starts the week on a positive note, reclaiming the $4,100 psychological level as the US Dollar (USD) retreats from its recent highs. The precious metal recovers from Friday's losses, although investors remain cautious ahead of Tuesday's US Consumer Price Index (CPI) report, which could determine the next direction for Bullion.