Metals producer KGHM ( KGH Stock) should continue higher
The stock of KGHM PolskaMiedź S.A. is attracting the high attention of investors and traders. It has demonstrated an impressive rally since our initial article from August 2020. As a matter of fact, advance of indices on the one hand and powerful acceleration in commodities like copper and silver on the other have provided a double effect on the price behavior of the KGHM. Here, we present an updated view and the outlook for the stock which one can trade under tickers $KGH at WSE and $KGHPF in the US in form of ADRs.
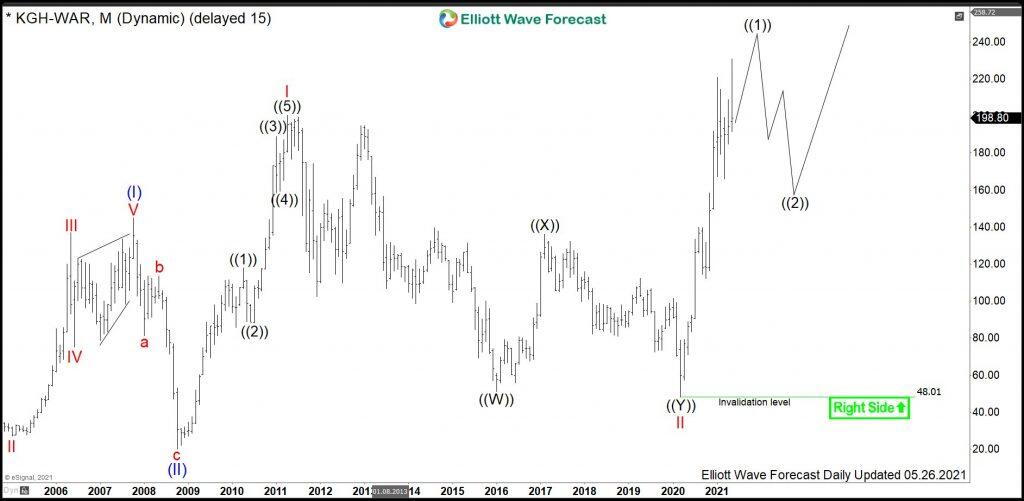
KGHM monthly Elliott Wave analysis
The monthly chart below shows the KGHM shares $KGH traded at Warsaw Stock Exchange. First, from the all-time lows, the stock price has developed a cycle higher in wave (I). Hereby, KGHM has printed atop in October 2007 at 145. Since the red wave III of blue wave ((I)) shows a price separation higher, the cycle up is obviously an impulse. From the highs, a correction lower in wave (II) has unfolded as a zigzag correction being a 5-3-5 structure. It has found an important bottom in October 2008 at 20.10.
From the 2008 lows, another motive cycle has started. KGHM has broken the 2007 highs at 145 in a 5 waves move in the red wave I. Hereby, the share price has printed a high in April 2011 at 200.30. From there, a multi-year correction in wave II has started. Hereby, one can recognize a double three pattern. It has ended in March 2020 with a capitulation move down to 48.
From the March 2020 lows at 48, KGHM has started a new cycle higher in wave III of (III). It has been confirmed by breaking to the new all-time highs. The target area for wave III to end is 229.05-340.55 and possibly higher. As of right now, the first leg up has reached already the minimum expectations. It is the preferred view that the leg up is the wave ((1)) of III being still in progress. Once finished, a pullback in wave ((2)) should find support in 3, 7, 11 swings above March 2020 lows at 48 for a rally to new highs.
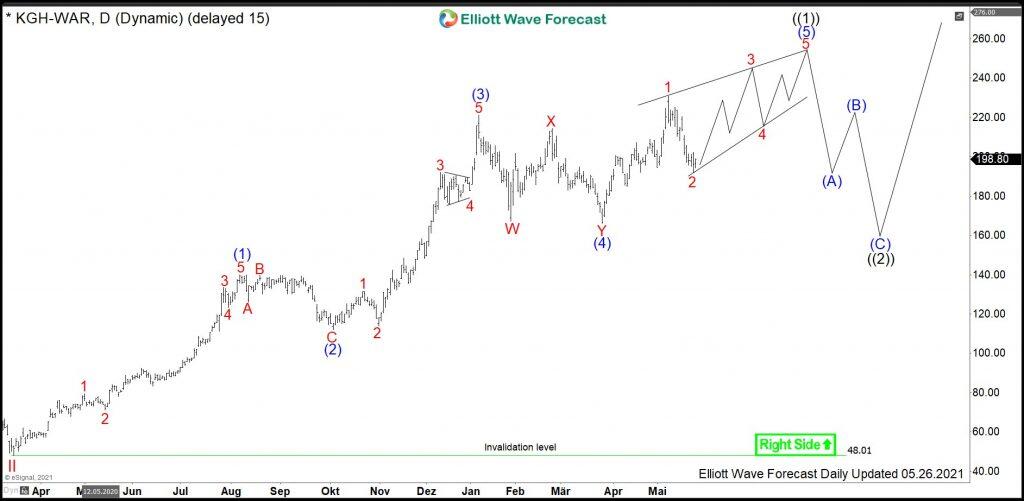
KGHM daily Elliott Wave analysis
The Daily chart below shows in more detail the advance higher from the March lows at 48. The cycle up within wave ((1)) remains still intact and might be currently in the wave (5) of ((1)). Together with major indices and copper, expect the march 2020 cycle to continue. However, the major advance within wave ((1)) might be over. Now, a wave (5) can drift sideways to higher in form of an ending diagonal. Investors and traders should be looking to buy wave ((2)) in 3, 7, or 11 swings against the March 2020 lows for another extension higher in wave ((3)).
Premium
You have reached your limit of 3 free articles for this month.
Start your subscription and get access to all our original articles.
Author

Elliott Wave Forecast Team
ElliottWave-Forecast.com


