Meta stock eyes key overhead level after explosive earnings beat

Meta Platforms (META), the social media and technology giant behind Facebook, Instagram, and WhatsApp, delivered a thunderous earnings beat Wednesday night that has the stock surging in pre-market trading. Yet the path to this moment tells a compelling technical story that started back in late October.
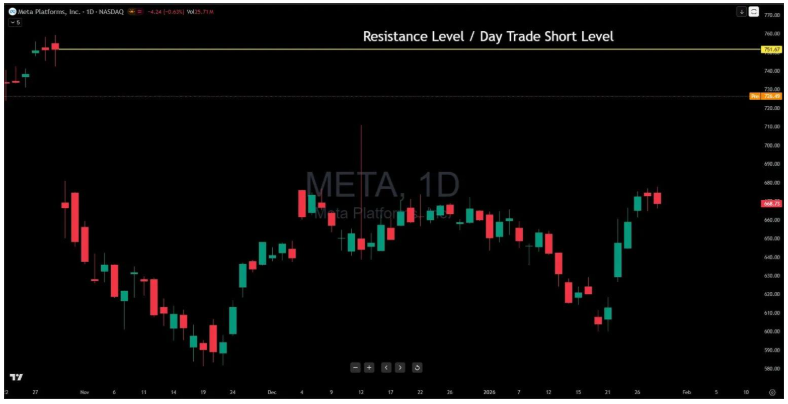
In late October, META experienced a sharp selloff that created a significant gap down from the $751.67 level, sending the stock tumbling all the way to the $600 area. That gap—the empty space left behind when price plunged without trading at intermediate levels—now sits as a major technical barrier above current prices. What followed was the kind of messy, whippy price action that tests traders' patience. The stock chopped around in the $620-$660 range for several sessions, creating a frustrating consolidation zone where neither bulls nor bears could establish clear control.
But the selling wasn't done yet. Bears regained control and drove META back down to retest those $600 lows, creating what looked like a potential double bottom scenario. This second trip to $600 became the inflection point. Instead of breaking lower, bulls came roaring back with conviction, snapping the price right back above that earlier $620-$660 chop zone. That move signaled something important: the buyers had finally taken control.
From there, META began climbing steadily, eventually grinding its way up to Wednesday's close at $668.73. Then came last night's earnings report, and the numbers were spectacular. META posted $8.88 per share against expectations of $8.21, crushing estimates by nearly 4% while delivering $59.89 billion in revenue—a 23.78% year-over-year surge that proved the company's advertising business and AI investments are firing on all cylinders.
The market's response? META is trading at $729.43 in pre-market, a massive gap-up that has the stock climbing right into that unfilled gap from late October. That yellow line at $751.67 isn't merely minor resistance—it's the top of the gap zone, the exact level where the October selloff began. Gaps have a magnetic quality in technical analysis, often attracting price back to fill them, but they also represent areas of significant supply where previous owners got trapped. We're talking about just $22 away in pre-market from testing this make-or-break level.
Here's what makes this setup fascinating: META has essentially retraced the entire October decline and validated that double bottom at $600. The fact that buyers defended $600 twice, then powered through the consolidation zone, and now gap higher on strong fundamentals creates a textbook bullish scenario. If META can push through and fill that gap above $751.67, it resolves a major technical overhang and opens the door to fresh all-time highs with minimal overhead resistance.
However, gaps also act as resistance precisely because they represent trapped sellers. Anyone who bought near $751 in late October before the gap down has been underwater for months. Day traders eyeing short setups will watch this zone closely—a failure to break through after such a strong earnings gap could trigger aggressive profit-taking and renewed selling pressure, potentially sending META back toward that $700 support zone or even the $668.73 Wednesday close where today's gap originated.
What is also striking here for me is the alignment of the technicals and the fundamentals. That double bottom at $600 was more than just a chart pattern—it represented accumulation by investors who saw value while others panicked. The steady climb back through resistance, followed by an earnings beat that validates their thesis, sets up a potential gap-fill scenario that could resolve months of technical damage in a single session.
For position traders, the playbook is clear: if META fills the gap and holds above $751.67 with volume confirmation, we're likely headed toward $800+ with minimal overhead resistance. A rejection at the gap resistance keeps us range-bound between $700-$750 until the next catalyst emerges. My experience tells me gaps on strong earnings often get defended, but when you're climbing into an unfilled gap from a major selloff, that's where real battles unfold.
The risk management piece is straightforward. Bulls need to see that gap filled and $751.67 taken out and held as new support. Any sustained move back below $700 would invalidate today's gap and suggest sellers aren't ready to let go of that resistance zone. That $600 level, now tested twice and defended, becomes your ultimate line in the sand for longer-term bullish positions.
META's journey from October's gap-down selloff to last night's explosive earnings gap-up tells the story of a stock that found its footing, built a base, and rewarded patient bulls. The real test arrives today—will buyers push through that gap resistance and complete this reversal, or will trapped sellers from October defend their break-even point one more time?
Author

Benjamin Pool
Verified Investing
A seasoned financial expert with a passion for empowering individuals to mastering smart money management.


