McDonald’s Corp. Elliott Wave technical analysis [Video]
![McDonald’s Corp. Elliott Wave technical analysis [Video]](https://editorial.fxstreet.com/images/TechnicalAnalysis/ChartPatterns/PointFigure/hand-drawing-stock-chart-63151915.jpg)
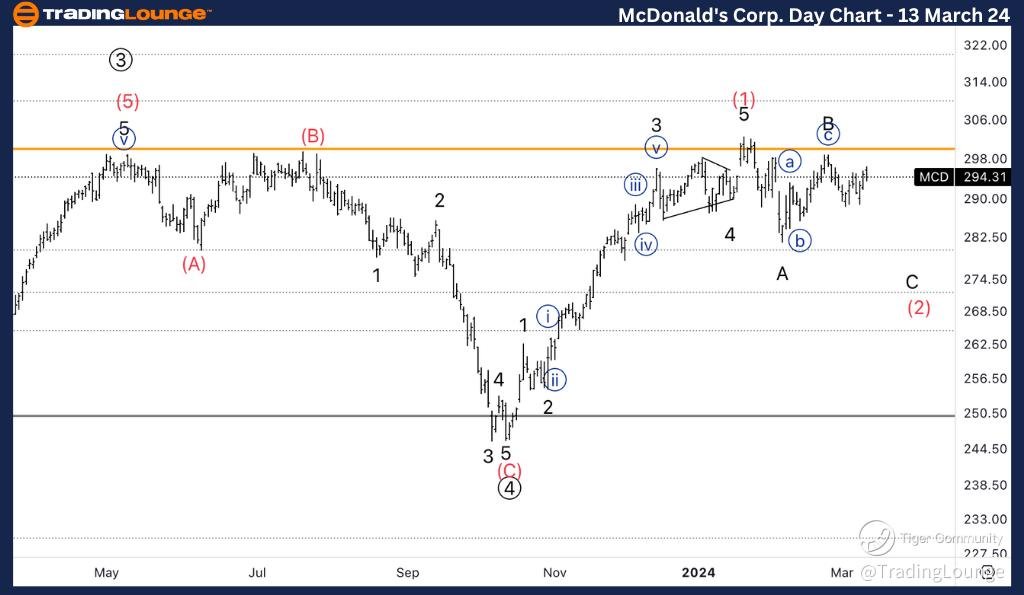
MCD Elliott Wave technical analysis
Function: Counter Trend.
Mode: Corrective.
Structure: Flat.
Position: Wave (2) of 3.
Direction: Downside into wave C of (2).
Details: After breaking ATH at 300$, we’ve seen a pullback which appears to be bullish corrective. We are therefore looking for continuation higher once the pullback is complete.
XOM Elliott Wave technical analysis – Daily chart
In our analysis, we identify a counter trend function characterized by corrective mode and a flat structure. Positioned in Wave (2) of 3, our attention is on the downside movement into wave C of (2). Despite breaking the all-time high (ATH) at $300, we've witnessed a pullback that appears to be part of a bullish corrective pattern. Consequently, we anticipate a continuation higher once the pullback completes its course.
MCD Elliott Wave technical analysis
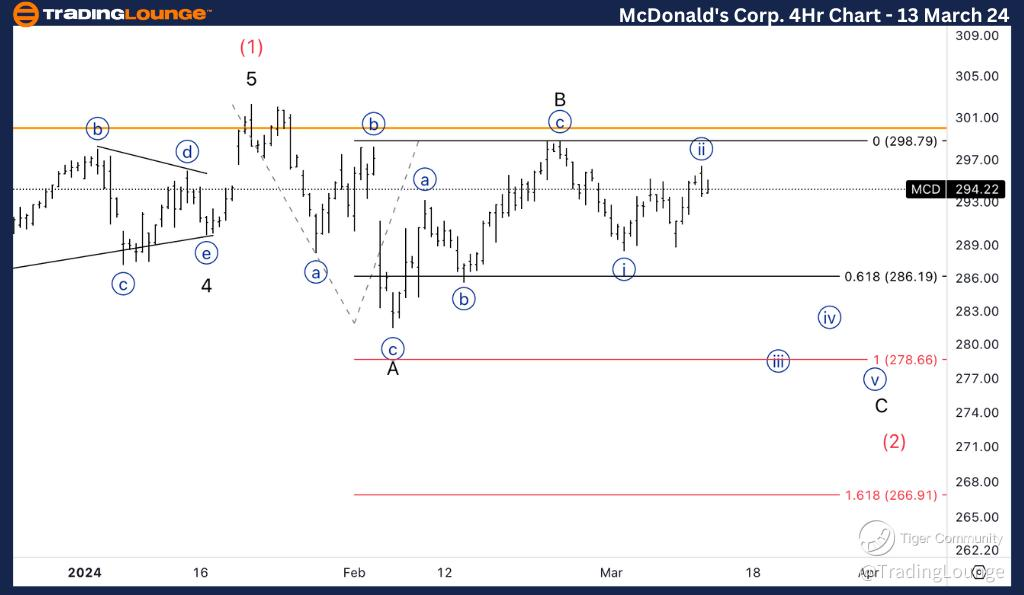
Function: Counter Trend.
Mode: Corrective.
Structure: Flat.
Position: Wave C of (2).
Direction: Wave {iii} of C.
Details: Looking for downside into wave {iii} as we need complete wave C. We could also see a sideways wave B before resuming lower.
XOM Elliott Wave technical analysis – Four hour chart
Here, we also observe a counter trend function marked by corrective mode and a flat structure. Positioned in Wave C of (2), our focus is on wave {iii} of C, anticipating downside movement to complete wave C. Additionally, we may see a sideways wave B before the downward trajectory resumes.
MCD Elliott Wave technical analysis [Video]
Author

Peter Mathers
TradingLounge
Peter Mathers started actively trading in 1982. He began his career at Hoei and Shoin, a Japanese futures trading company.