Market reversal alert: Unveiling a strategic trading plan from the resistance zone [Video]
![Market reversal alert: Unveiling a strategic trading plan from the resistance zone [Video]](https://editorial.fxstreet.com/images/TechnicalAnalysis/ChartPatterns/Candlesticks/digital-tablet-with-stock-charts-30235834_XtraLarge.jpg)
Watch the free-preview video above extracted from the WLGC session before the market open on 30 Apr 2024 below to find out the following:
- How to spot the momentum exhaustion in the S&P 500.
- The pivot point to confirm the potential reversal scenario.
- A key sign traders are looking for when a reversal happens.
- How to identify a meaningful resistance zone.
The reversal was anticipated 1 day before the live session as posted in the 30s market update post on 29 Apr 2024.
Market environment
The bullish vs. bearish setup is 233 to 142 from the screenshot of my stock screener below.
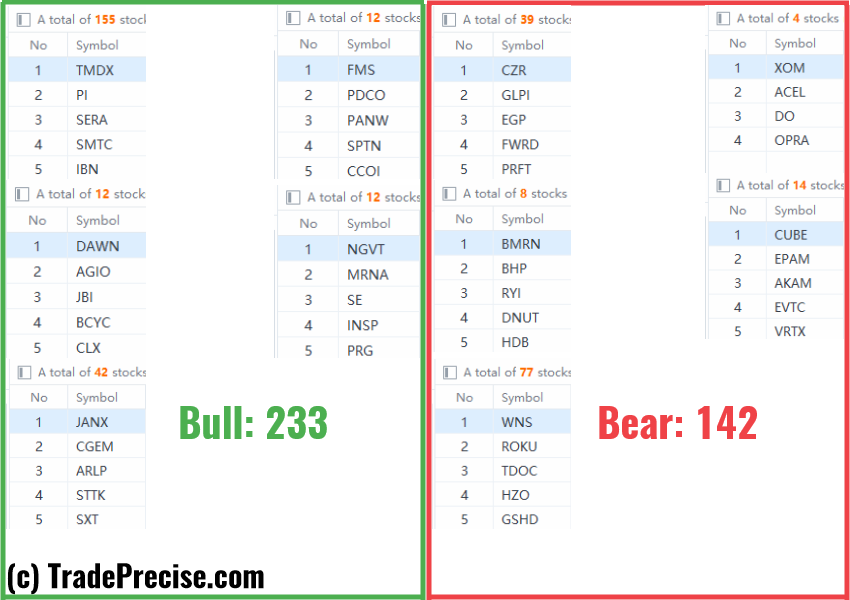
Although the market environment and the market breadth are positive, a potential reversal in the market could easily mess up the long setup.
Focus on the outperformers is the key when buying in this market environment.
Market comment
3 “low-hanging fruits” REVG trade entries setup + 16 actionable setups SOXS, TECS, XLK and 3 “wait and hold” candidates were discussed during the live session before the market open (BMO).

REVG
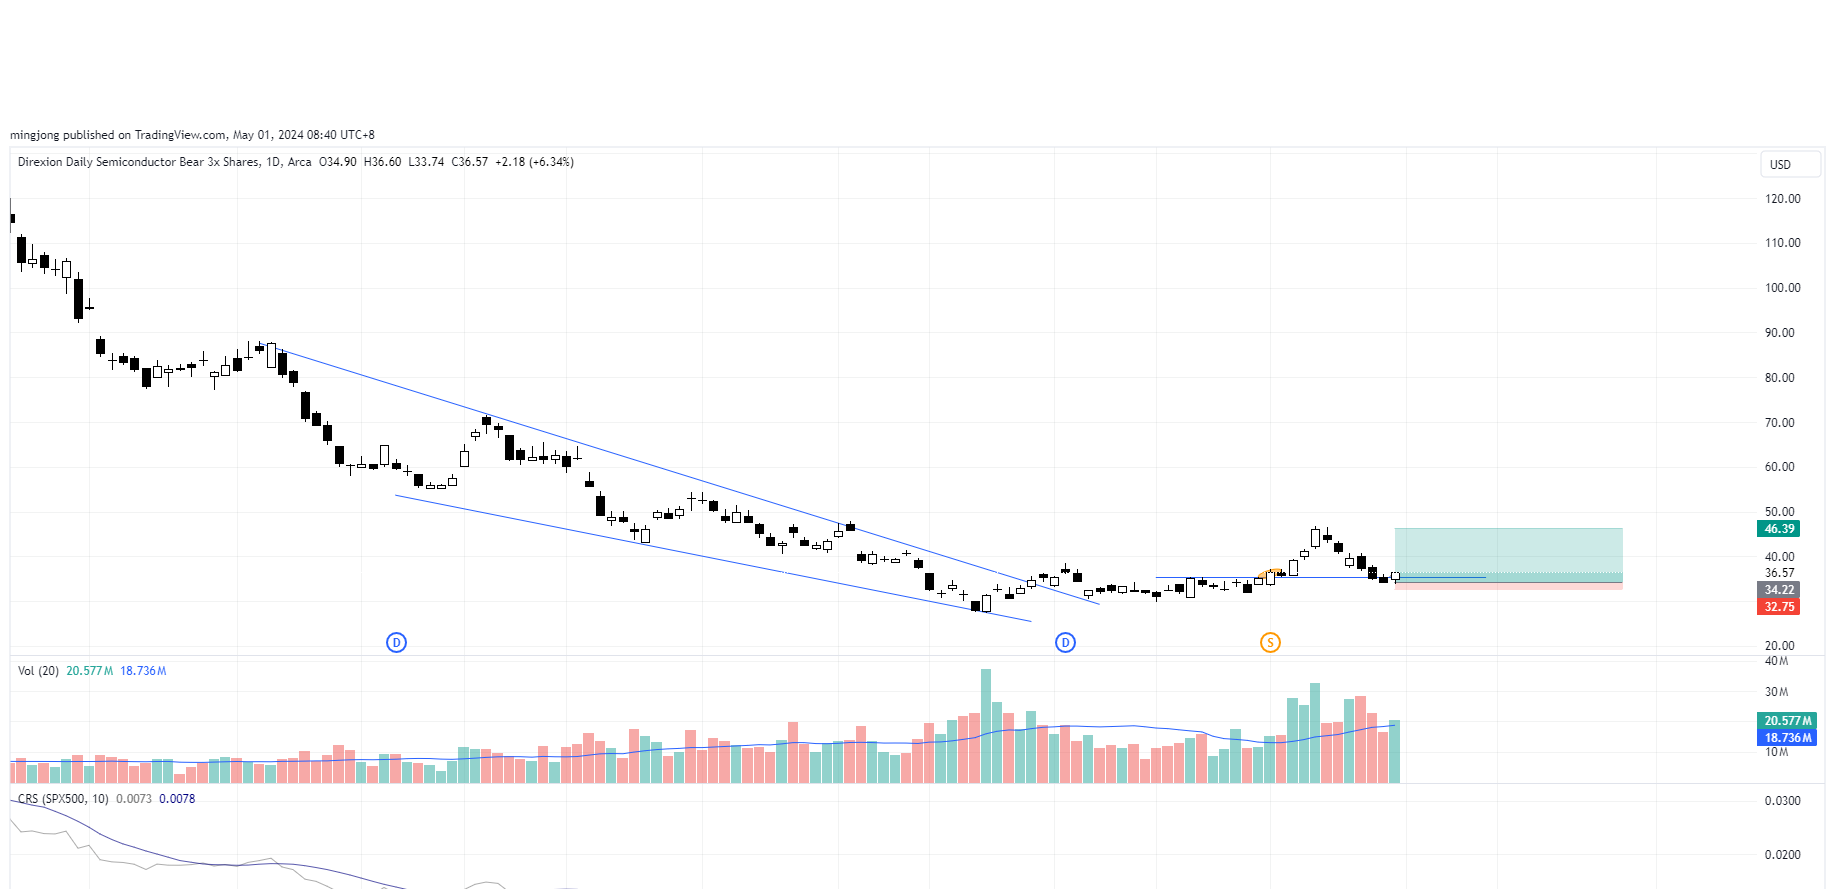
SOXS
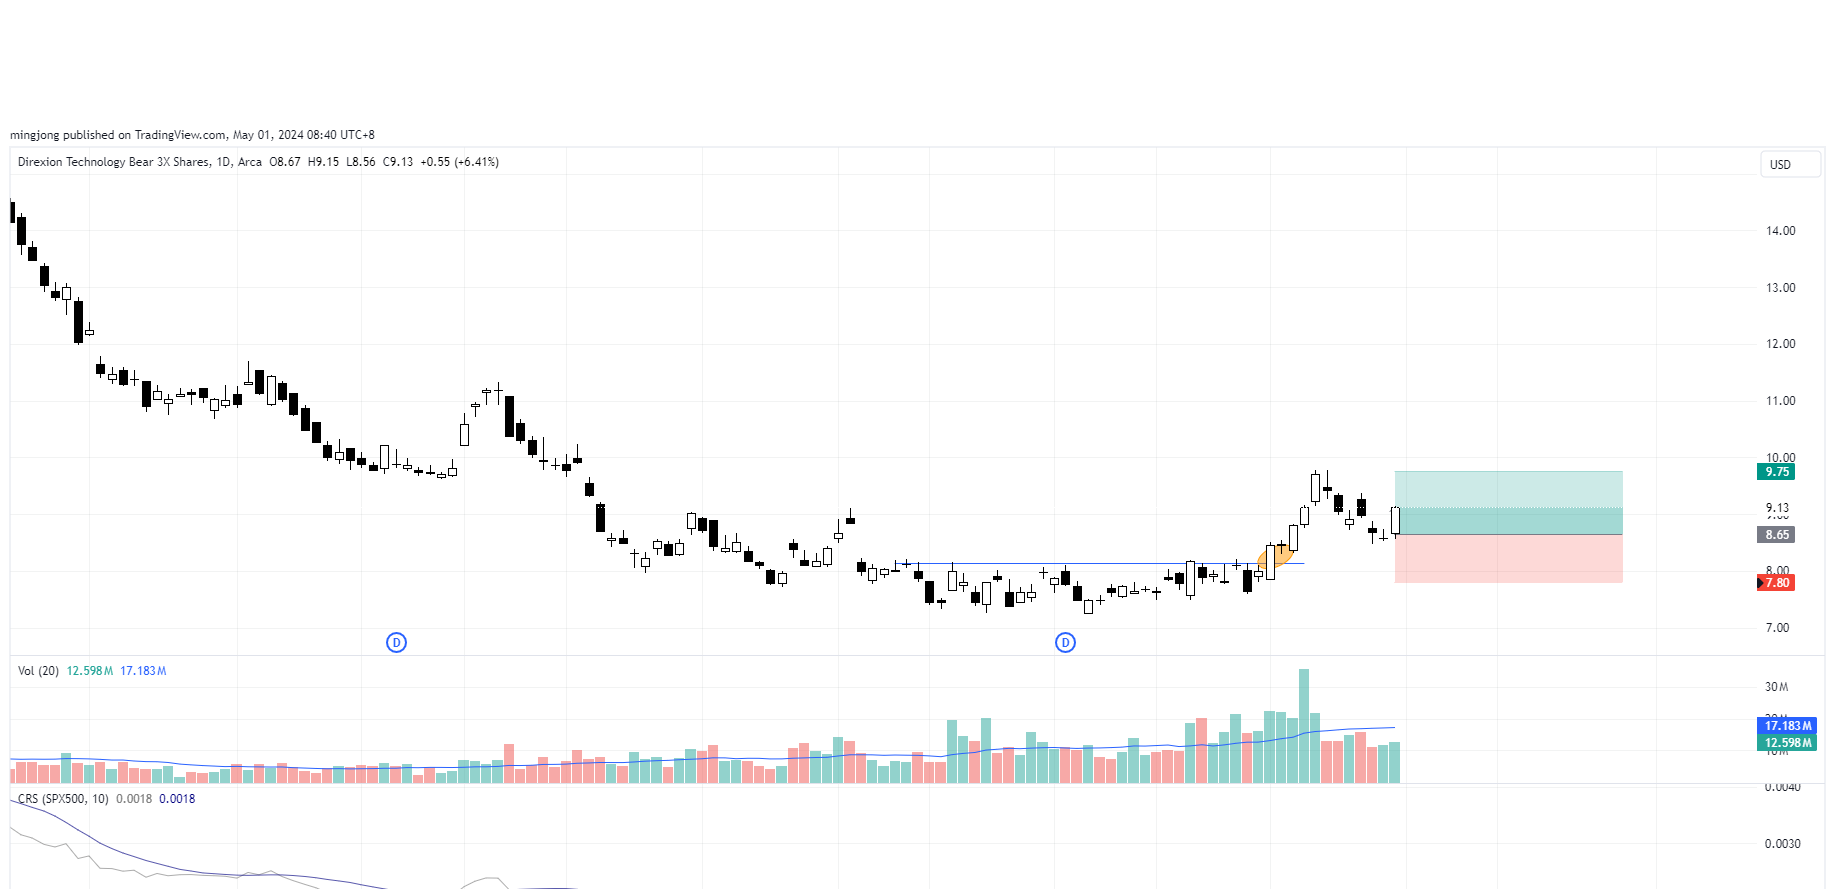
TECS
Author

Ming Jong Tey
Independent Analyst
Ming Jong Tey has been trading since 2008. He started his learning journey from technical analysis (indicators, Fibonacci, etc...) to value investing. Throughout his journey, he develops an interest in price action with chart pattern trading.


