|

Liquidia (LQDA): Buy the breakout or wait for pullback?

Liquidia Corporation, (LQDA) is a biopharmaceutical company. It develops, manufactures & commercializes various products for unmet patient needs in the United States. It comes under Healthcare sector in Biotechnology Industry & trades as “LQDA” ticker at Nasdaq.

As discussed in last article, it extends rally in impulse I from June-2025 low. It should extend into $38.16 – $40.90 area to finish the wave ((5)) as I before correction start. We like to buy the pullback in 3, 7 or 11 swings at extreme area, when reach.

LQDA – Elliott Wave latest weekly view

Chart

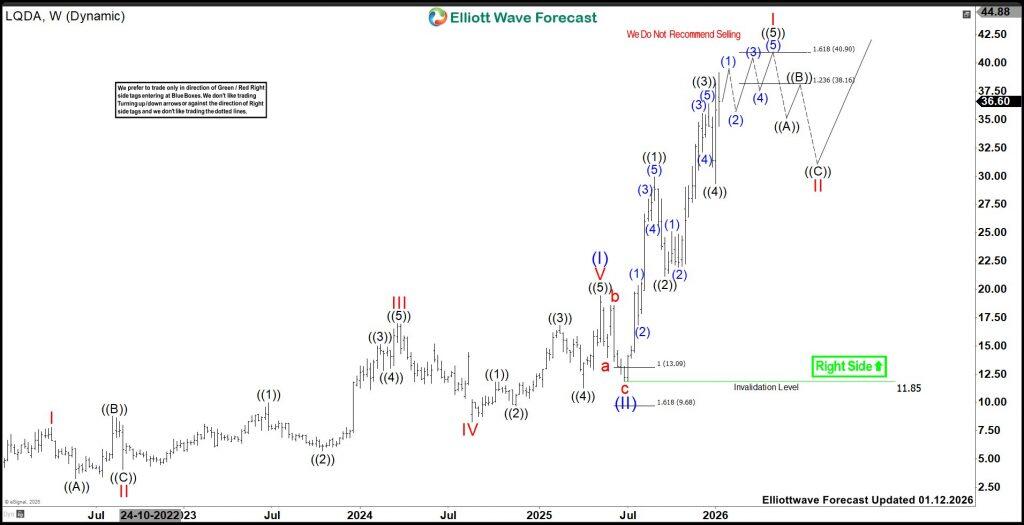
In weekly, it broke the previous ATH from October-2018 in last rally & confirms bullish bias. It favors rally in I of (III) against June-2025 low. From August-2021 low, it placed I of (I) at $7.78 high, II at $4.06 low, III at $16.99 high, IV at $8.26 low & V at $19.41 high in May-2025. It corrected lower in (II) in 3 swings, which ended at $11.85 low in June-2025 low. Above (II) low, it placed ((1)) of I at $29.94 high, ((2)) at $21.15 low, ((3)) at $36.41 high, ((4)) at $29.30 low & favors rally in ((5)).

LQDA – Elliott Wave view from 8.25.2025

Chart

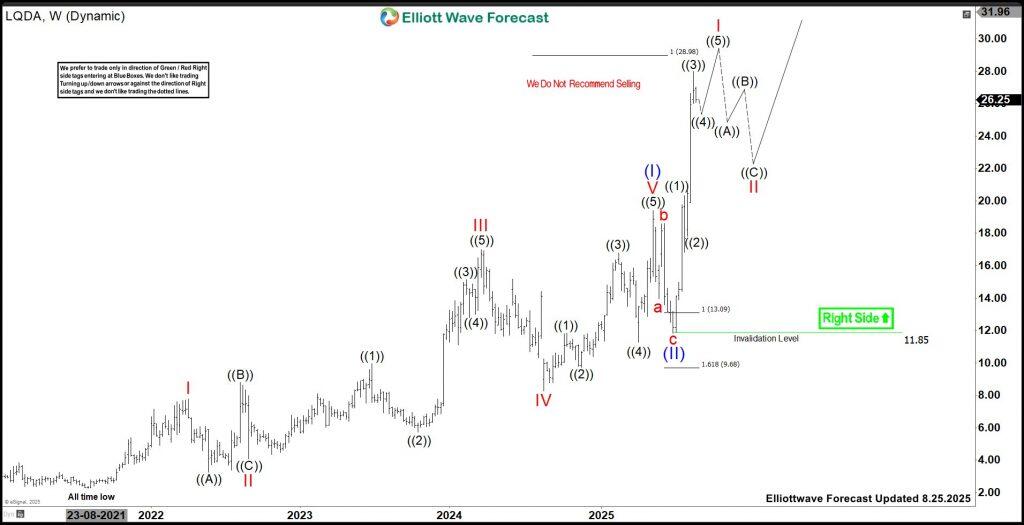
Within ((1)), it ended (1) at $20.33 high, (2) at $16.82 low, (3) at $28.82 high (4) at $26.06 low & (5) at $29.94 high. Within ((3)), it placed (1) at $25.12 high, (2) at $21.94 low, (3) at $35.54 high, (4) at $32.11 low & (5) at $36.41 high. Currently, it favors rally in (1) of ((5)) & expect minor high before correcting in (2). As long as it stays above $29.30 low of 1.05.2026, it should extend higher in 5 swings to finish ((5)). The ((5)) expects to extend into $38.16 – $40.90 area to finish I impulse before correcting next. It already reached the minimum area, so if it breaks below $29.30 low, it can be II as alternate view. We like to buy the pullback in 3, 7 or 11 swings in II against June-2025 low. If it managed to erase the momentum divergence, then it can be nesting in I.

Author

Elliott Wave Forecast Team

Elliott Wave Forecast Team

ElliottWave-Forecast.com

More from Elliott Wave Forecast Team
Share:

Editor's Picks

EUR/USD weakens as US jobs data trims Fed rate cut bets

The EUR/USD pair trades in negative territory for the third consecutive day near 1.1860 during the early European session on Thursday. Traders will keep an eye on the US weekly Initial Jobless Claims data. On Friday, the attention will shift to the US Consumer Price Index inflation report. 

GBP/USD bullish outlook prevails above 1.3600, UK GDP data looms

The GBP/USD pair gains ground near 1.3635, snapping the two-day losing streak during the early European session on Thursday. The preliminary reading of UK Gross Domestic Product for the fourth quarter will be closely watched later on Thursday. The UK economy is estimated to grow 0.2% QoQ in Q4, versus 0.1% in Q1. 

Gold remains on the defensive below two-week top; lacks bearish conviction amid mixed cues

Gold sticks to modest intraday losses through the Asian session on Thursday, though it lacks follow-through selling and remains close to a nearly two-week high, touched the previous day. The commodity currently trades above the $5,070 level, down just over 0.20% for the day, amid mixed cues.

UK GDP set to post weak growth as markets rise bets on March rate cut

Markets will be watching closely on Thursday, when the United Kingdom’s Office for National Statistics will release the advance estimate of Q4 Gross Domestic Product. If the data land in line with consensus, the UK economy would have continued to grow at an annualised pace of 1.2%, compared with 1.3% recorded the previous year. 

The market trades the path not the past

The payroll number did not just beat. It reset the tone. 130,000 vs. 65,000 expected, with a 35,000 whisper. 79 of 80 economists leaning the wrong way. Unemployment and underemployment are edging lower. For all the statistical fog around birth-death adjustments and seasonal quirks, the core message was unmistakable. The labour market is not cracking.

Sonic Labs’ vertical integration fuels recovery in S token

Sonic, previously Fantom (FTM), is extending its recovery trade at $0.048 at the time of writing, after rebounding by over 12% the previous day. The recovery thesis’ strengths lie in the optimism surrounding Sonic Labs’ Wednesday announcement to shift to a vertically integrated model, aimed at boosting S token utility.