|

Lam Research (LRCX) Elliott Wave update: Bullish trend intact despite ongoing correction

Lam Research (LRCX) remains bullish despite a corrective wave IV. Elliott Wave analysis suggests further upside potential as wave V approaches.

Lam Research Corporation (LRCX) shows a strong long-term bullish trend based on Elliott Wave analysis. The multi-decade chart highlights a clear impulsive structure that began in the early 2000s. After finishing a large corrective move, labeled as cycle wave II, the stock began a steady and powerful rally.

Wave III topped with a well-defined five-wave pattern from the 2009 low. The chart shows strong momentum and clean internal subdivisions, supporting the view of an extended bullish phase. Now, Lam Research is undergoing a correction in wave IV, which appears to form a double zigzag. The corrective sequence is labeled as ((W))-((X))-((Y)).

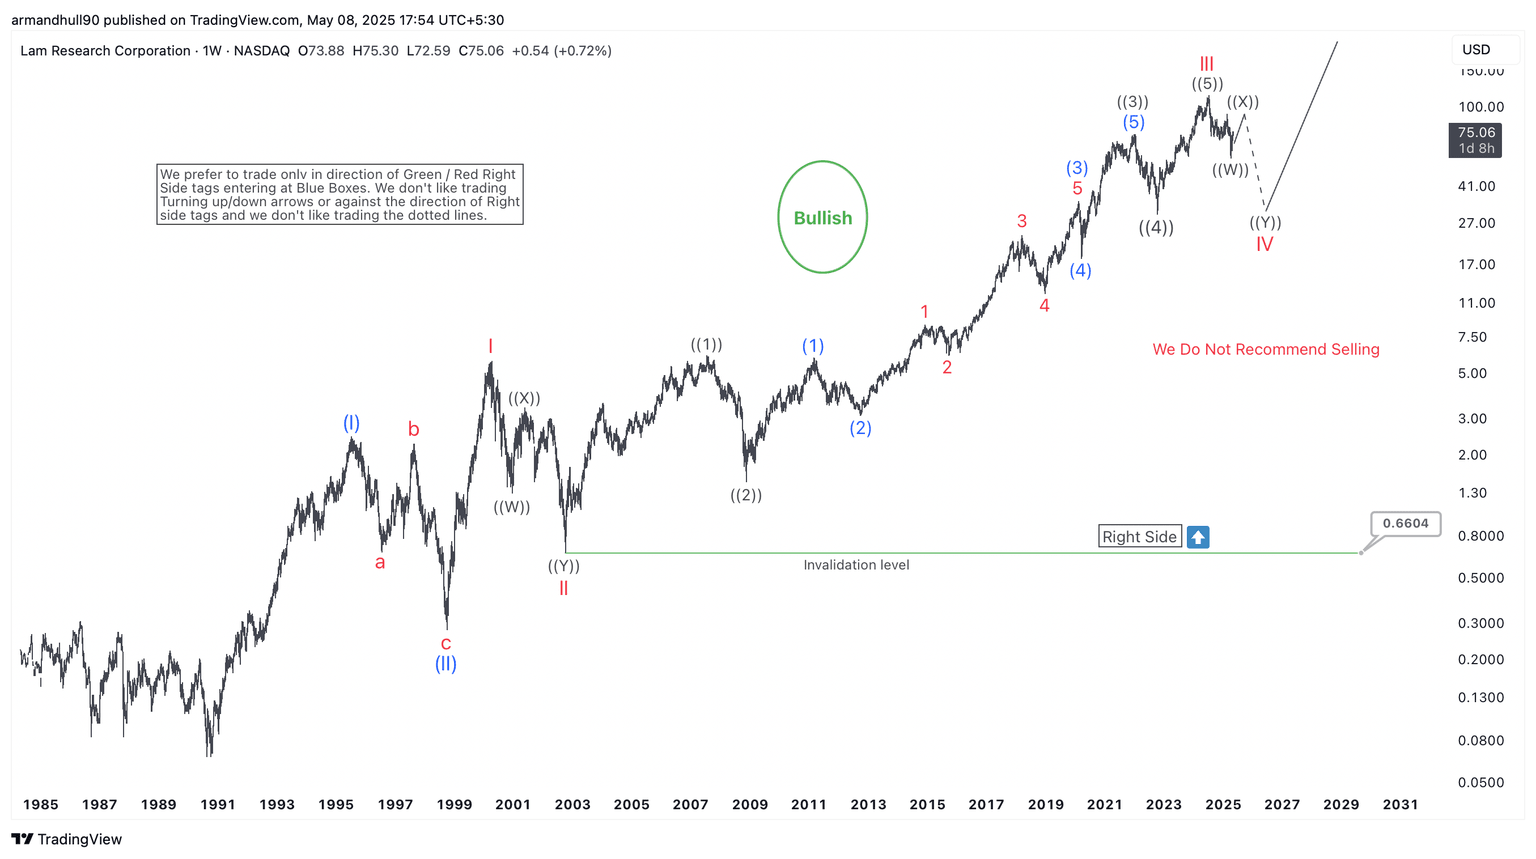
The key support lies at $0.6604. As long as the price stays above this level, the bullish view remains valid. The chart features a Right Side tag and a clear note: “We Do Not Recommend Selling.” This signals that the trend remains up and traders should not go against it. Pullbacks like the current one offer a chance to enter at better prices, not a reason to exit.

Wave IV is still in progress, but once it completes, wave V should begin. This final leg is expected to break into new all-time highs. While exact timing is uncertain, the setup continues to favor buyers over the long run.

Author

Elliott Wave Forecast Team

Elliott Wave Forecast Team

ElliottWave-Forecast.com

More from Elliott Wave Forecast Team
Share:

Markets move fast. We move first.

Orange Juice Newsletter brings you expert driven insights - not headlines. Every day on your inbox.

By subscribing you agree to our Terms and conditions.

Editor's Picks

EUR/USD struggles for direction amid USD gains

EUR/USD is trimming part of its earlier gains, coming under some mild downside pressure near 1.1730 as the US Dollar edges higher. Markets are still digesting the Fed’s latest rate decision, while also looking ahead to more commentary from Fed officials in the sessions ahead.

GBP/USD drops to daily lows near 1.3360

Disappointing UK data weighed on the Sterling towards the end of the week, triggering a pullback in GBP/USD to fresh daily lows near 1.3360. Looking ahead, the next key event across the Channel is the BoE meeting on December 18.

Gold losses momentum, challenges $4,300

Gold now gives away some gains and disputes the key $4,300 zone per troy ounce following earlier multi-week highs. The move is being driven by expectations that the Fed will deliver further rate cuts next year, with the yellow metal climbing despite a firmer Greenback and rising US Treasury yields across the board.

Litecoin Price Forecast: LTC struggles to extend gains, bullish bets at risk

Litecoin (LTC) price steadies above $80 at press time on Friday, following a reversal from the $87 resistance level on Wednesday. Derivatives data suggests a bullish positional buildup while the LTC futures Open Interest declines, flashing a long squeeze risk.

Big week ends with big doubts

The S&P 500 continued to push higher yesterday as the US 2-year yield wavered around the 3.50% mark following a Federal Reserve (Fed) rate cut earlier this week that was ultimately perceived as not that hawkish after all. The cut is especially boosting the non-tech pockets of the market.

Aave Price Forecast: AAVE primed for breakout as bullish signals strengthen

Aave (AAVE) price is trading above $204 at the time of writing on Friday and approaching the upper boundary of its descending parallel channel; a breakout from this structure would favor the bulls.