KOSPI composite index Elliott Wave technical analysis [Video]
![KOSPI composite index Elliott Wave technical analysis [Video]](https://editorial.fxsstatic.com/images/i/nvidia-02_XtraLarge.jpg)
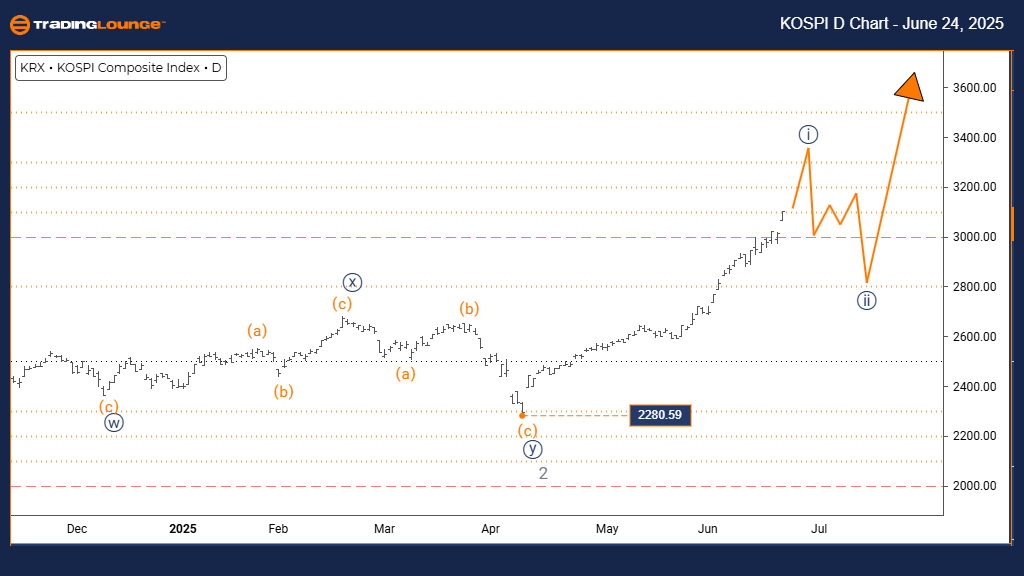
KOSPI Composite Elliott Wave analysis
Function: Bullish Trend.
Mode: Impulsive.
Structure: Navy Blue Wave 1.
Position: Gray Wave 3.
Direction next lower degrees: Navy Blue Wave 2.
Details:
Gray Wave 2 appears to be complete. Navy Blue Wave 1 of 3 is now forming.
Wave cancel invalid level: 2280.59.
The daily Elliott Wave chart of the KOSPI Composite shows a bullish trend. The index is moving impulsively, indicating strong momentum. Navy Blue Wave 1 is currently active, developing within the broader Gray Wave 3.
The completion of Gray Wave 2 marks the start of Navy Blue Wave 1, suggesting a new upward leg in the trend. The next expected movement is Navy Blue Wave 2, which typically follows Wave 1 as a corrective pullback before resuming upward movement.
The key level to monitor is 2280.59. A break below this would invalidate the current count and require reassessment. Unless breached, the pattern supports a continued uptrend.
The technical setup indicates KOSPI may experience continued gains. The impulsive structure reflects strong buying activity and supports a bullish outlook as Gray Wave 3 progresses.
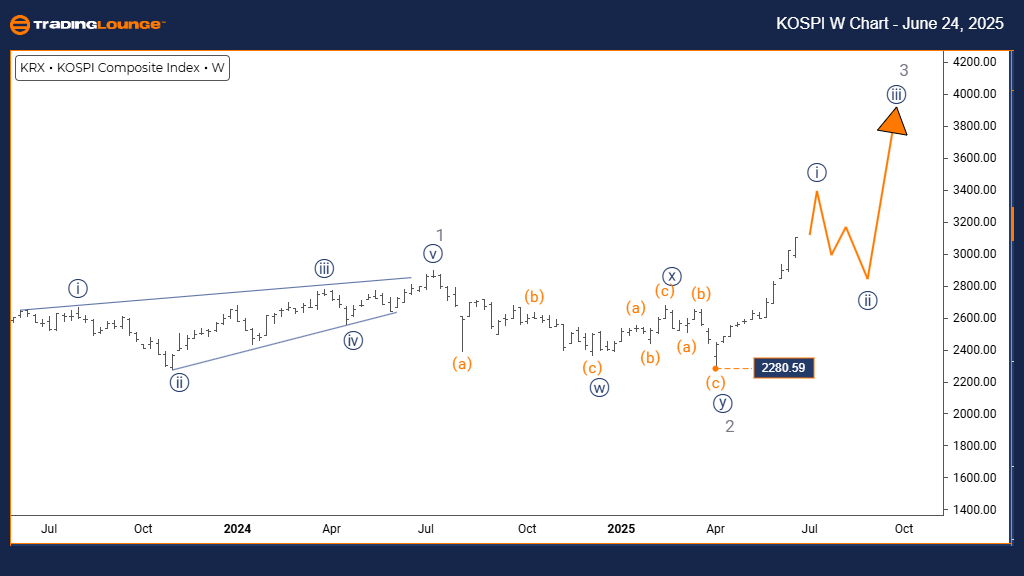
KOSPI Composite Elliott Wave technical analysis
Function: Bullish Trend.
Mode: Impulsive.
Structure: Navy Blue Wave 1.
Position: Gray Wave 3.
Direction next lower degrees: Navy Blue Wave 2.
Details:
Gray Wave 2 has likely ended. Now, Navy Blue Wave 1 of 3 is advancing.
Wave cancel invalid level: 2280.59
The weekly Elliott Wave analysis confirms the bullish trend in KOSPI. With impulsive movement active, Navy Blue Wave 1 is forming within Gray Wave 3. This setup signals the beginning of a potentially large new uptrend.
The completed Gray Wave 2 confirms the transition into Navy Blue Wave 1. This phase is usually strong and fast-moving. Once Wave 1 completes, Wave 2 is expected as a corrective phase.
A critical level to watch remains 2280.59. Falling below it would void the current analysis. Until then, the trend favors continued upward development within Gray Wave 3.
The chart suggests a solid uptrend may be underway. Robust institutional interest and impulsive price action support the case for sustained gains in the medium to long term.
KOSPI Composite Elliott Wave analysis [Video]
Author

Peter Mathers
TradingLounge
Peter Mathers started actively trading in 1982. He began his career at Hoei and Shoin, a Japanese futures trading company.


