KOSPI Composite Elliott Wave technical analysis [Video]
![KOSPI Composite Elliott Wave technical analysis [Video]](https://editorial.fxstreet.com/images/Markets/Equities/list-of-stock-market-indices-21508951_XtraLarge.jpg)
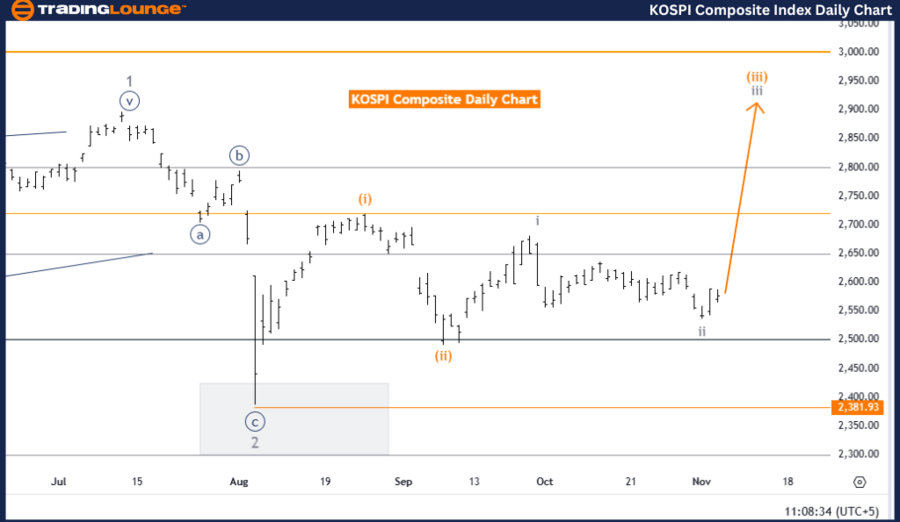
KOSPI Composite Elliott Wave analysis - Day chart.
KOSPI Composite Elliott Wave technical analysis
- Trend: Bullish
- Mode: Impulsive
- Current Structure: Gray wave 3
- Position: Orange wave 3
- Next Higher Degree: Gray wave 3 (initiated)
- Wave Cancel Invalid Level: 2381.93
Analysis overview
The daily Elliott Wave analysis for the KOSPI Composite indicates a bullish trend in an impulsive mode, specifically within gray wave 3. This suggests a strong upward movement in line with the broader bullish framework. With gray wave 2 now appearing complete, gray wave 3 has begun, indicating renewed upward momentum within this wave structure. Typically, gray wave 3 reflects the most intense phase of an impulsive wave, often associated with significant price gains in the near term.
Current position: Orange wave 3
The KOSPI Composite is currently situated within orange wave 3, a phase that generally exhibits accelerated growth. This suggests that the market remains well-positioned for continued gains, reinforcing the overall bullish trend. The progression through gray wave 3 supports this analysis, with indications of a sustained upward trajectory as long as the wave structure remains intact.
Wave cancel invalid level
A critical invalidation level is set at 2381.93. Any price decline below this threshold would invalidate the current wave setup, potentially signaling a deviation from the anticipated bullish trend. However, as long as the price remains above this level, the bullish outlook holds, with gray wave 3 expected to continue pushing higher.
Summary
The KOSPI Composite is presently in a bullish impulsive phase, with gray wave 3 active and progressing. Provided the price stays above 2381.93, the upward trend should persist, with orange wave 3 further supporting potential gains. This analysis suggests that market strength is likely to continue within the existing Elliott Wave structure, signaling sustained growth potential.
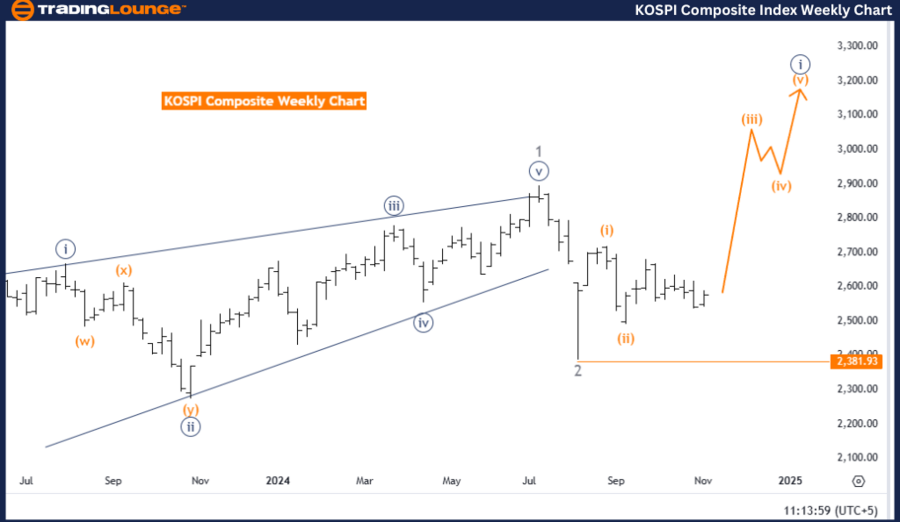
KOSPI Composite Elliott Wave Analysis - Weekly Chart
KOSPI Composite Elliott Wave technical analysis
-
Trend: Bullish
-
Mode: Impulsive
-
Current structure: Orange wave 3
-
Position: Navy blue wave 1
-
Next higher degree: Orange wave 3 (initiated)
-
Wave cancel invalid level: 2381.93
Analysis overview
The weekly Elliott Wave analysis for the KOSPI Composite reveals a bullish trend within an impulsive mode at orange wave 3, suggesting ongoing upward momentum. With orange wave 2 now completed, the index has transitioned into orange wave 3, a phase typically associated with pronounced market advances. This shift indicates that the KOSPI Composite is well-positioned for potential growth in alignment with the broader bullish outlook.
Current position: Navy blue wave 1
The index's placement within navy blue wave 1 further supports the upward movement. Being part of orange wave 3, a particularly robust wave in an impulsive sequence, it suggests sustained upward price action. The continuation of this upward trend in orange wave 3 is likely, assuming favorable market conditions and a stable wave structure.
Wave cancel invalid level
A critical support level is set at 2381.93. A price drop below this threshold would invalidate the current wave structure, potentially signaling a deviation from the bullish trend. However, as long as the price holds above this level, the bullish structure is expected to remain intact, allowing the upward trend to continue.
Summary
The KOSPI Composite is currently situated in a bullish impulsive wave structure, with the transition to orange wave 3 marking the onset of a phase that typically aligns with further growth. Provided the price remains above the invalidation level of 2381.93, the index is likely to sustain its upward trajectory, with additional gains anticipated as the bullish wave structure progresses.
KOSPI Composite Elliott Wave technical analysis [Video]
Author

Peter Mathers
TradingLounge
Peter Mathers started actively trading in 1982. He began his career at Hoei and Shoin, a Japanese futures trading company.


