KO alert: Is an ending diagonal about to disrupt the rally?

Coca-Cola (KO) shows resilience in a shifting market. In Q2 2025, it posted 5% organic revenue growth and 58% EPS jump. Despite currency headwinds, KO improved operating margin to 34.1%, driven by pricing power, cost control, and strategic campaigns like “Share a Coke.”
Although unit case volume dipped slightly due to weather and consumer pressure, Coca-Cola Zero Sugar and core brands gained momentum. Analysts remain optimistic, highlighting KO’s brand loyalty, strong dividend, and flexible pricing as key strengths in uncertain conditions.
Looking ahead, Coca-Cola plans to launch a cane sugar-based product in the U.S. this fall. At the same time, it reevaluates Costa Coffee’s future after underwhelming performance since 2018. Financially, KO holds solid fundamentals with a P/E ratio of 24.46 and a $297B market cap.
Despite a temporary dip in free cash flow from a $6.1B Fairlife payment, KO maintains strong long-term guidance. It projects 8% EPS growth for the year. Banks and analysts share a bullish outlook. MarketBeat reports a consensus “Buy” rating and a $77.21 price target—an 11.89% upside.
Technical analysts highlight a breakout zone between $67.74 and $69.14. They cite KO’s pricing power and dividend yield as key entry signals. As September brings volatility, KO’s defensive profile and global brand appeal attract institutional investors seeking stability.
Elliott Wave outlook ending diagonal: KO monthly chart September 2025
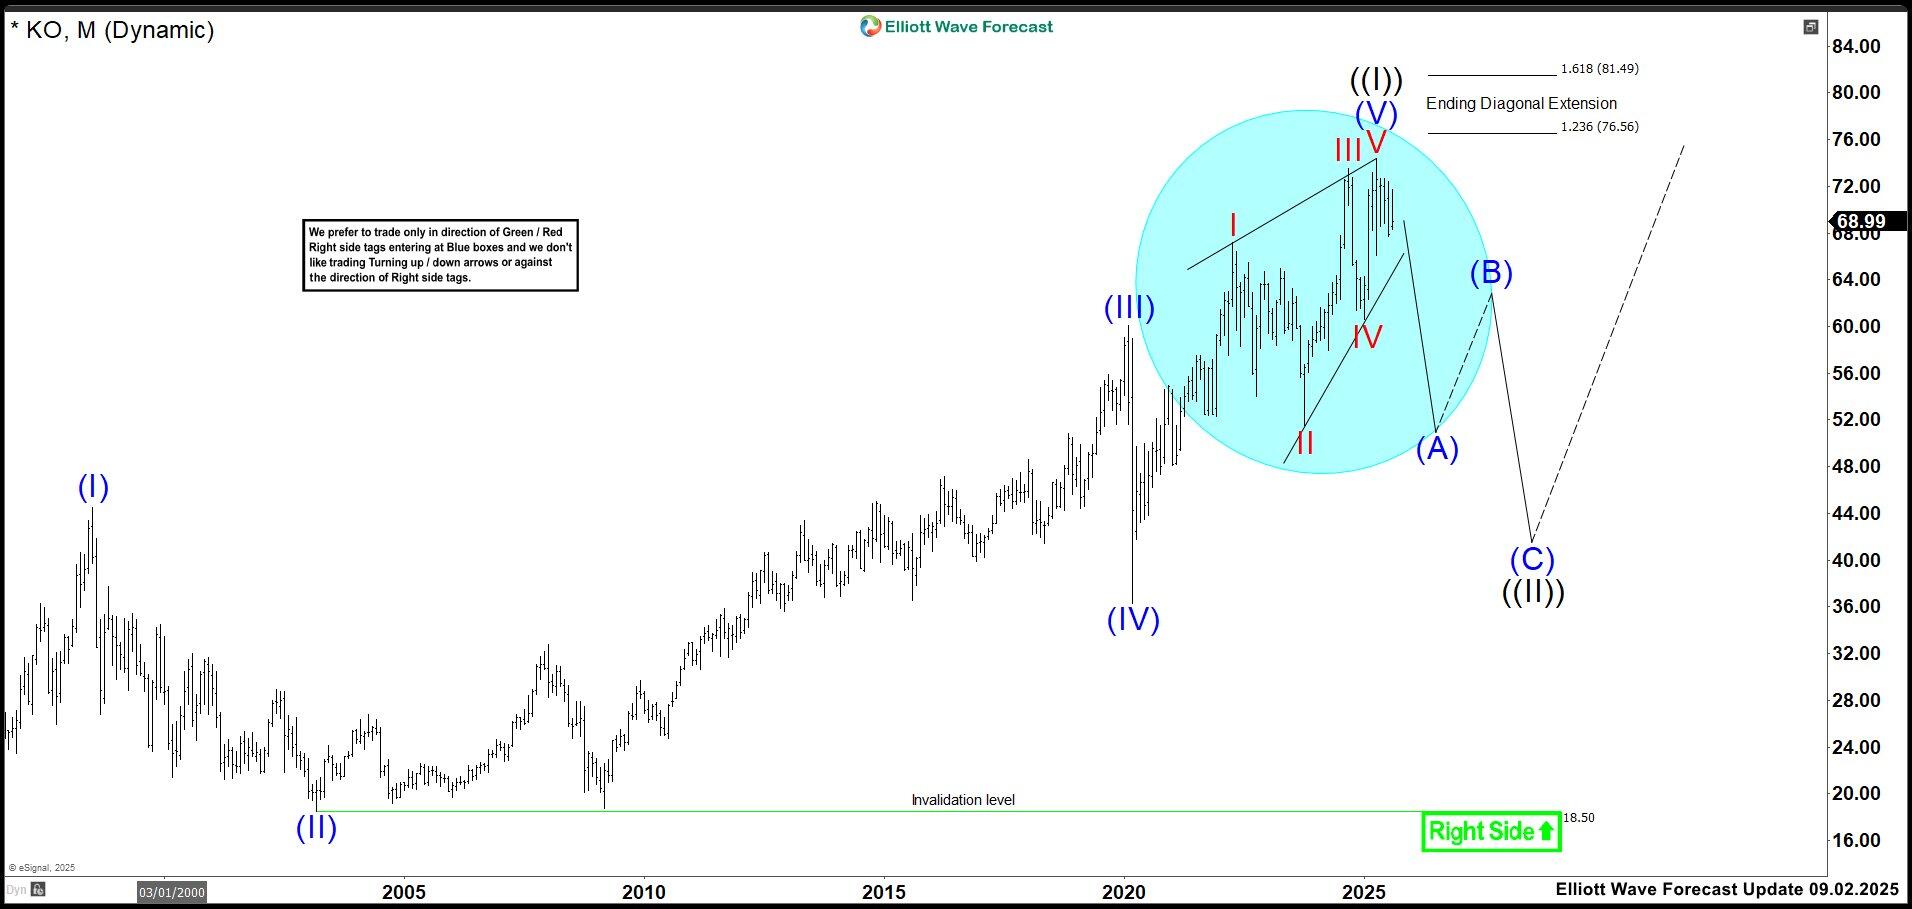
On KO’s monthly chart, we’ve identified a leading diagonal from the all-time low to April 2025 high as wave ((I)). Wave (V) of ((I)) appears to form an ending diagonal, confirmed through technical analysis. This Elliott Wave pattern often signals exhaustion, suggesting the market may be losing bullish momentum. If the structure proves correct, long-term investors should prepare for a possible correction. In the worst-case scenario, price could drop toward the $40.00 zone. This setup deserves close attention, especially as structural patterns often precede major shifts.
Elliott Wave outlook nest: KO monthly chart September 2025
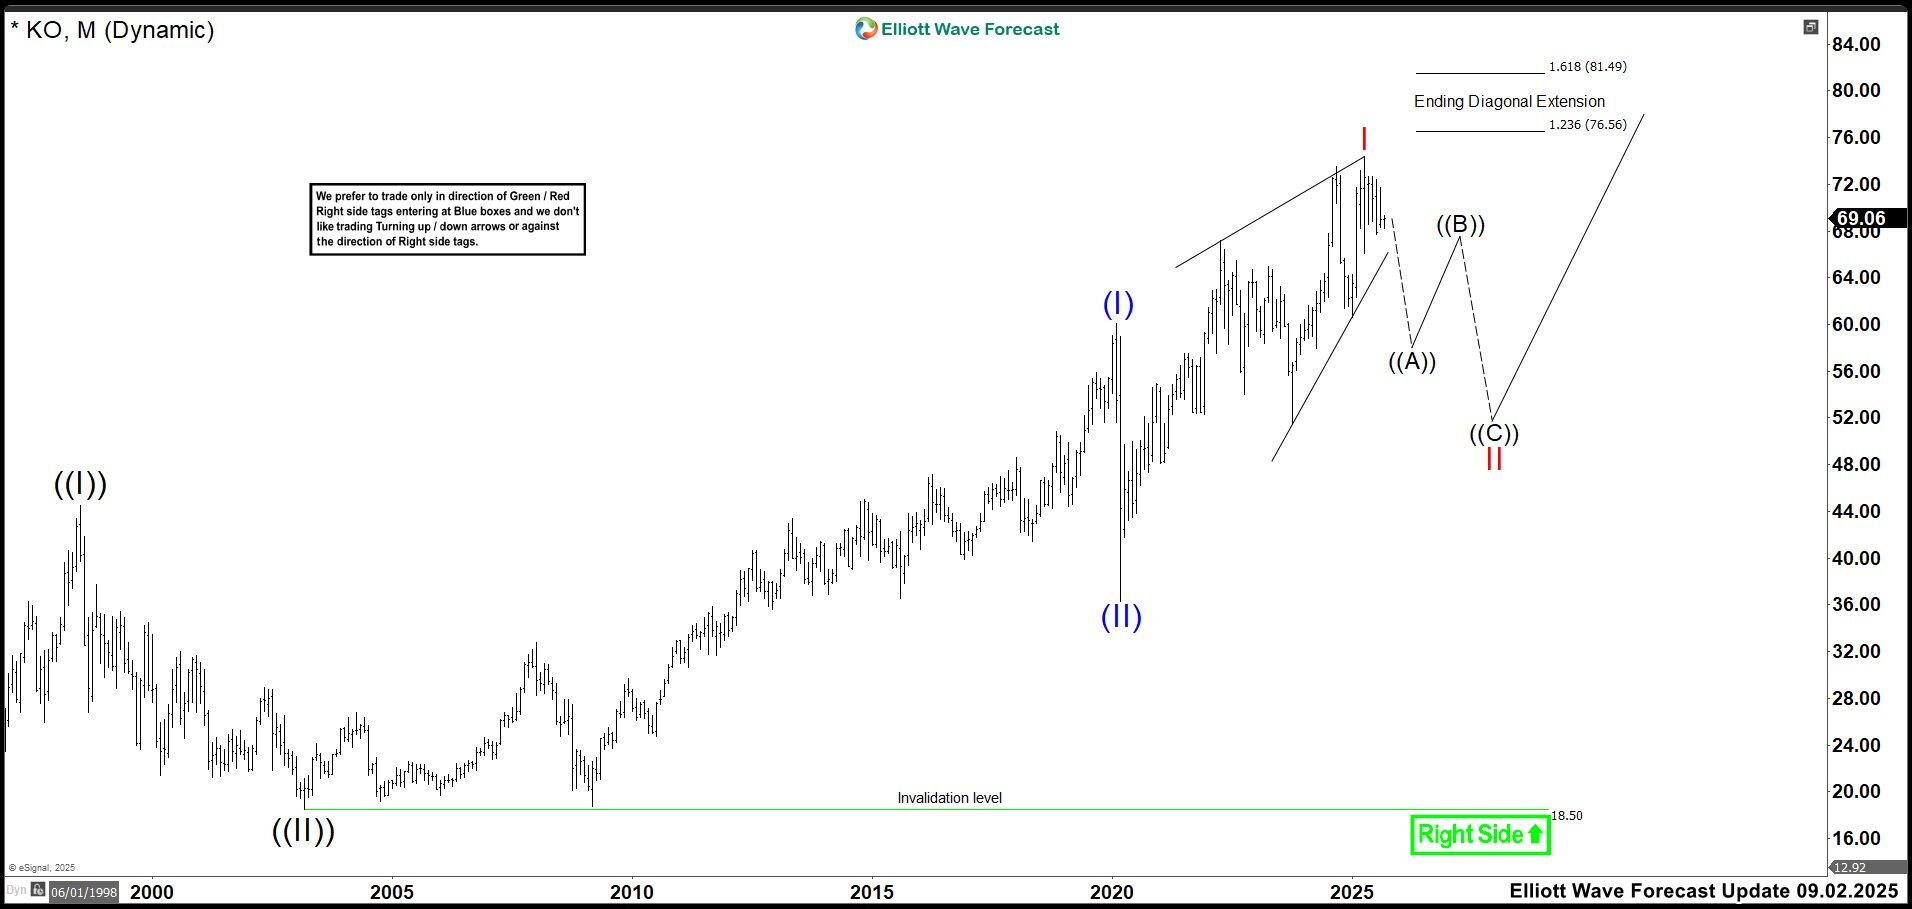
Another way to view the chart is as a nest, multiple 1-2 waves forming over time. Currently, we may be in wave I-II. Unlike the first scenario, this one implies a shallower correction. Therefore, wave II could drop only to the 60–50 zone before the rally resumes. If the ending diagonal holds, this setup is ideal. KO has shown strong bullish behavior with minor pullbacks, unless disrupted by major events like a recession or the 2020 pandemic. Additionally, we must consider a possible extension in the ending diagonal. This lies between 76.56 – 81.49 area. If KO reaches this zone without correcting and maintains the diagonal structure, the pullback may occur there. However, if price breaks above 81.49, the diagonal will fail, and KO would continue higher.
Elliott Wave outlook impulse: KO monthly chart September 2025
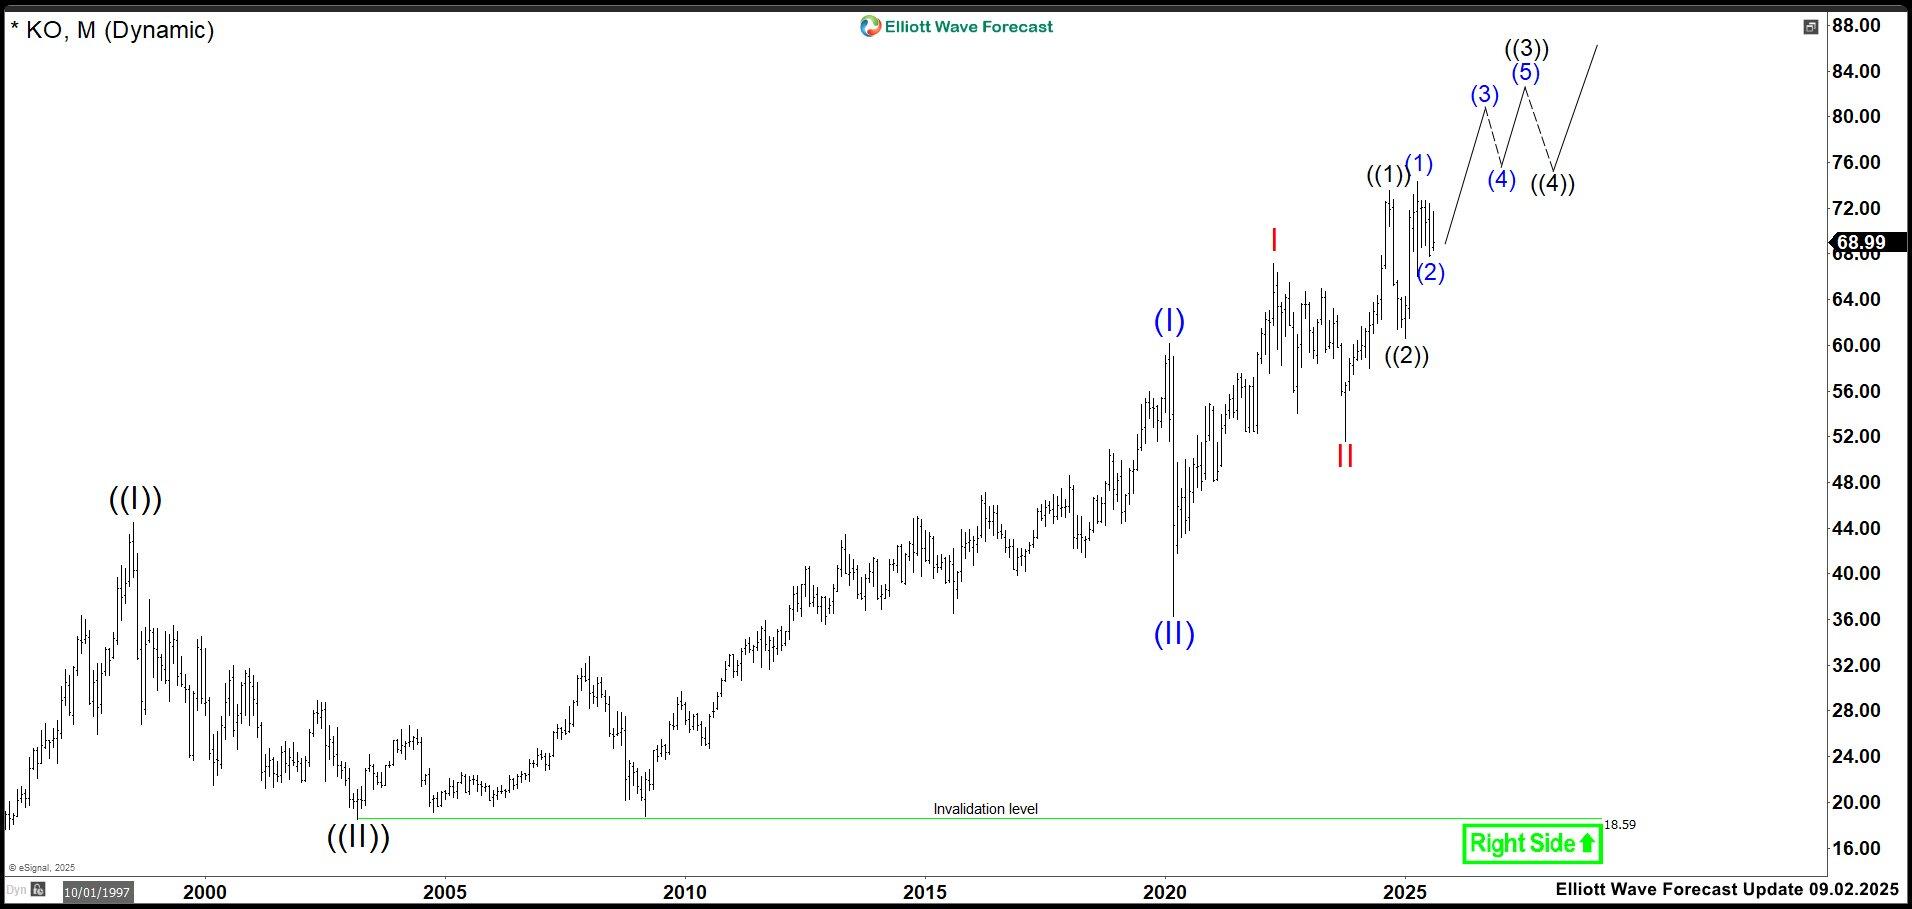
To conclude, this is the core idea that supports KO’s bullish outlook assuming no major correction unfolds. The goal is to generate new highs and controlled pullbacks, gradually building a long-term impulse that completes Coca-Cola’s cycle from its inception.
Author

Elliott Wave Forecast Team
ElliottWave-Forecast.com