NZD/USD: Kiwi stuck near 0.5900 as bullish momentum proves fickle


  • Kiwi holding near the middle, set to finish Friday near where it started.
  • Market flows are firmly in the hands of the US Dollar.
  • Risk sentiment getting limited knock-on positive support from upbeat China outlook.

The NZD/USD is set to finish Friday on a slight downstep, trading into the 0.5900 level and unable to find some lift. 

With little meaningful momentum coming from the Kiwi (NZD) side of things, the NZD is fully exposed to broader market flows, leaving the Greenback (USD) to dictate the direction of the pair.

China data beats bolstering beleaguered Kiwi

Risk appetite is being supported by additional stimulus from China, bolstering the Antipodeans and putting a floor beneath any major declines. Official Chinese data showed that industrial production and retail sales figures rose faster than expected, providing further support for market sentiment heading into the weekend.

Market flows for the NZD/USD are notably leaning into the US Dollar side, and the direction is following the broader Dollar Index. The USD saw some hesitation after the University of Michigan (UoM) Sentiment Index missed expectations, slipping more than expected to 67.7 from 69.5. Inflation expectations also slid from 3.0% to 2.7%.

The USD is now catching some bids across the board as markets ease into the week's market close.

NZD/USD technical outlook

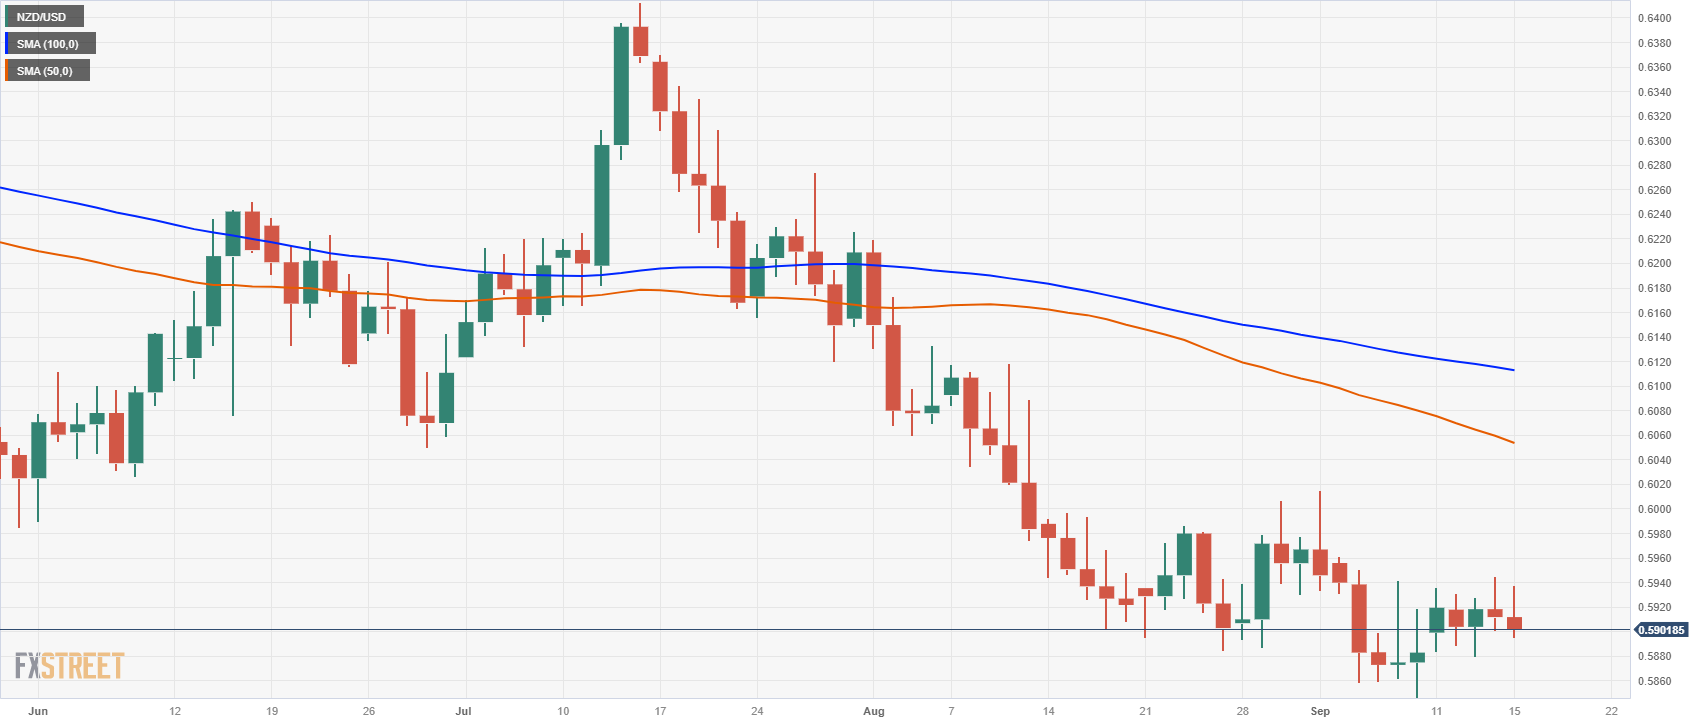
The Kiwi is constrained near the middle of price congestion that has become familiar territory for this trading week, caught in a rough near-term range between 0.5930 and 0.5890. 

Upside momentum will be constrained by the last swing high near 0.5980 on the daily candlesticks, which show the pair decidedly on the low end. Support is coming from September’s lows near 0.5860, and a further break to the downside sees little in the way of additional technical support.

The 50- and 100-day Simple Moving Averages (SMAs) are in a bearish decline, piled up at 0.6060 and 0.6120 respectively, and breaks above the 100-day SMA have struggled to sustain for some time in the NZD/USD pair.

NZD/USD daily chart

NZD/USD technical levels

NZD/USD

Overview
Today last price 0.5904
Today Daily Change -0.0008
Today Daily Change % -0.14
Today daily open 0.5912
 
Trends
Daily SMA20 0.5923
Daily SMA50 0.606
Daily SMA100 0.6114
Daily SMA200 0.6202
 
Levels
Previous Daily High 0.5945
Previous Daily Low 0.5901
Previous Weekly High 0.5961
Previous Weekly Low 0.5847
Previous Monthly High 0.6219
Previous Monthly Low 0.5885
Daily Fibonacci 38.2% 0.5918
Daily Fibonacci 61.8% 0.5929
Daily Pivot Point S1 0.5894
Daily Pivot Point S2 0.5876
Daily Pivot Point S3 0.585
Daily Pivot Point R1 0.5938
Daily Pivot Point R2 0.5964
Daily Pivot Point R3 0.5982


Share: Feed news

Information on these pages contains forward-looking statements that involve risks and uncertainties. Markets and instruments profiled on this page are for informational purposes only and should not in any way come across as a recommendation to buy or sell in these assets. You should do your own thorough research before making any investment decisions. FXStreet does not in any way guarantee that this information is free from mistakes, errors, or material misstatements. It also does not guarantee that this information is of a timely nature. Investing in Open Markets involves a great deal of risk, including the loss of all or a portion of your investment, as well as emotional distress. All risks, losses and costs associated with investing, including total loss of principal, are your responsibility. The views and opinions expressed in this article are those of the authors and do not necessarily reflect the official policy or position of FXStreet nor its advertisers. The author will not be held responsible for information that is found at the end of links posted on this page.

If not otherwise explicitly mentioned in the body of the article, at the time of writing, the author has no position in any stock mentioned in this article and no business relationship with any company mentioned. The author has not received compensation for writing this article, other than from FXStreet.

FXStreet and the author do not provide personalized recommendations. The author makes no representations as to the accuracy, completeness, or suitability of this information. FXStreet and the author will not be liable for any errors, omissions or any losses, injuries or damages arising from this information and its display or use. Errors and omissions excepted.

The author and FXStreet are not registered investment advisors and nothing in this article is intended to be investment advice.

Recommended content


Recommended content

Editors’ Picks

AUD/USD: Further gains need to clear 0.6460

AUD/USD: Further gains need to clear 0.6460


AUD/USD reversed three consecutive daily pullbacks in quite auspicious start to the week, regaining the 0.6400 barrier and putting its critical 200-day SMA near 0.6460 to the test on the back of the intense and renewed selling bias hurting the US Dollar.

EUR/USD: Minor support comes at 1.1060

EUR/USD: Minor support comes at 1.1060

EUR/USD climbed to the 1.1290 region at one point on Monday, though it later gave back part of those gains as the Greenback attempted to recover from its sharp decline, with investors continuing to digest Moody’s downgrade of the US credit rating on Friday.

Gold looks sidelined around $3,230

Gold looks sidelined around $3,230

Gold appears to have entered a range-bound phase around the $3,230 mark per troy ounce at the start of the week, as investors turned to safe-haven assets following Moody’s downgrade of the US government’s credit rating and renewed trade tensions.

Crypto products post $785 million of inflows as Strategy scoops up 7,390 Bitcoin

Crypto products post $785 million of inflows as Strategy scoops up 7,390 Bitcoin

Crypto products recorded a fifth straight week of inflows last week, adding $785 million and lifting its cumulative inflows in 2025 to $7.5 billion, according to CoinShares' weekly report on Monday.

China April slowdown shows the impact of economic uncertainty

China April slowdown shows the impact of economic uncertainty

Trade war uncertainty is denting Chinese confidence, resulting in slower economic activity in April. Retail sales and fixed-asset investment both underperformed forecasts amid heightened caution. Yet the impact on manufacturing was less than feared.

The Best brokers to trade EUR/USD

The Best brokers to trade EUR/USD

SPONSORED Discover the top brokers for trading EUR/USD in 2025. Our list features brokers with competitive spreads, fast execution, and powerful platforms. Whether you're a beginner or an expert, find the right partner to navigate the dynamic Forex market.

Forex MAJORS

Cryptocurrencies

Signatures

Best Brokers of 2025