JPMorgan (JPM) missed the blue box and rally as expected

JPMorgan Chase & Co. (JPM) is an American multinational investment bank and financial services holding company headquartered in New York City and incorporated in Delaware. As of December 31, 2021, JPMorgan Chase is the largest bank in the United States, the world’s largest bank by market capitalization, and the fifth-largest bank in the world in terms of total assets, with total assets totaling to US$3.831 trillion.
JPM daily chart September 2022
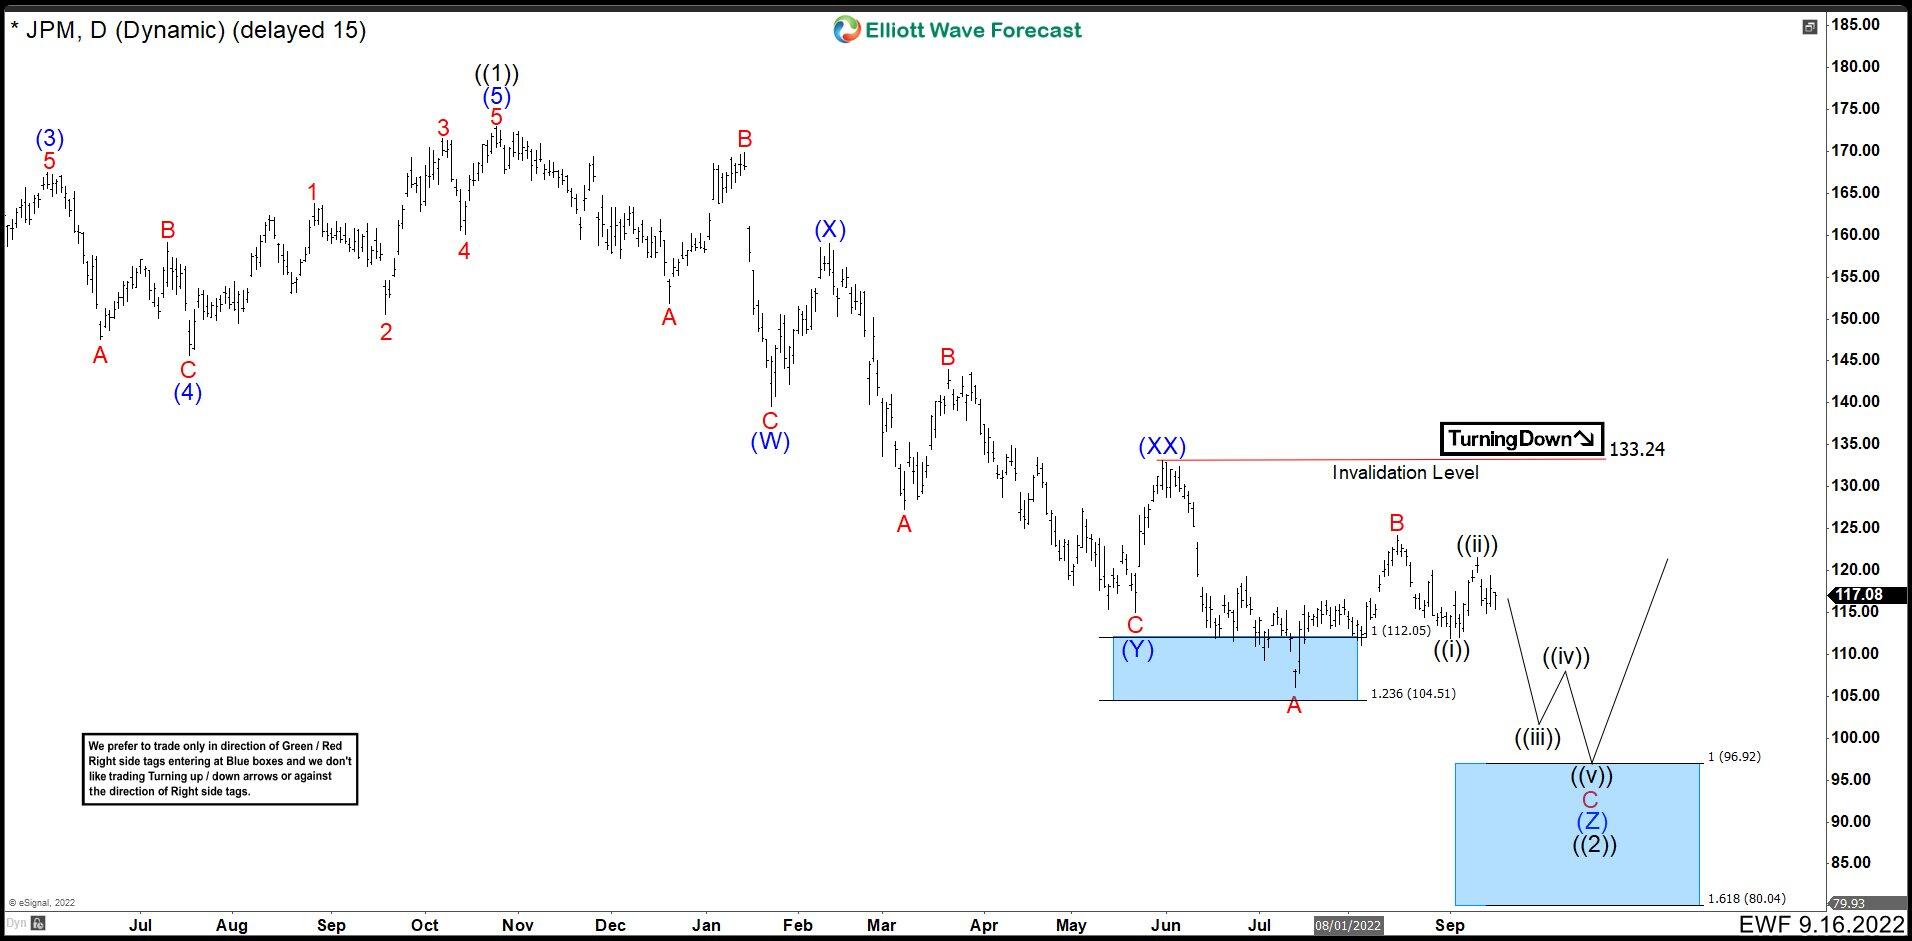
September last year, we gave a triple correction as an option to complete wave ((2)) in JPM. That was if the stock broke the blue box area in 109.08 – 106.13. The triple correction has a (W), (X), (Y), (XX), (Z) structure. Wave (XX) ended at 133.24 and from there we needed 3 swings down to complete wave (Z). Wave A of (Z) ended at 106.06 low. The 3 swings bounce ended at 124.24 as wave B. Then, we had to see a movement down towards 96.92 – 80.04 to complete wave C of (Z) and wave ((2)) before market continue with a rally. (If you want to learn more about Elliott Wave Theory, please follow these links: Elliott Wave Education and Elliott Wave Theory).
JPM daily chart January 2023
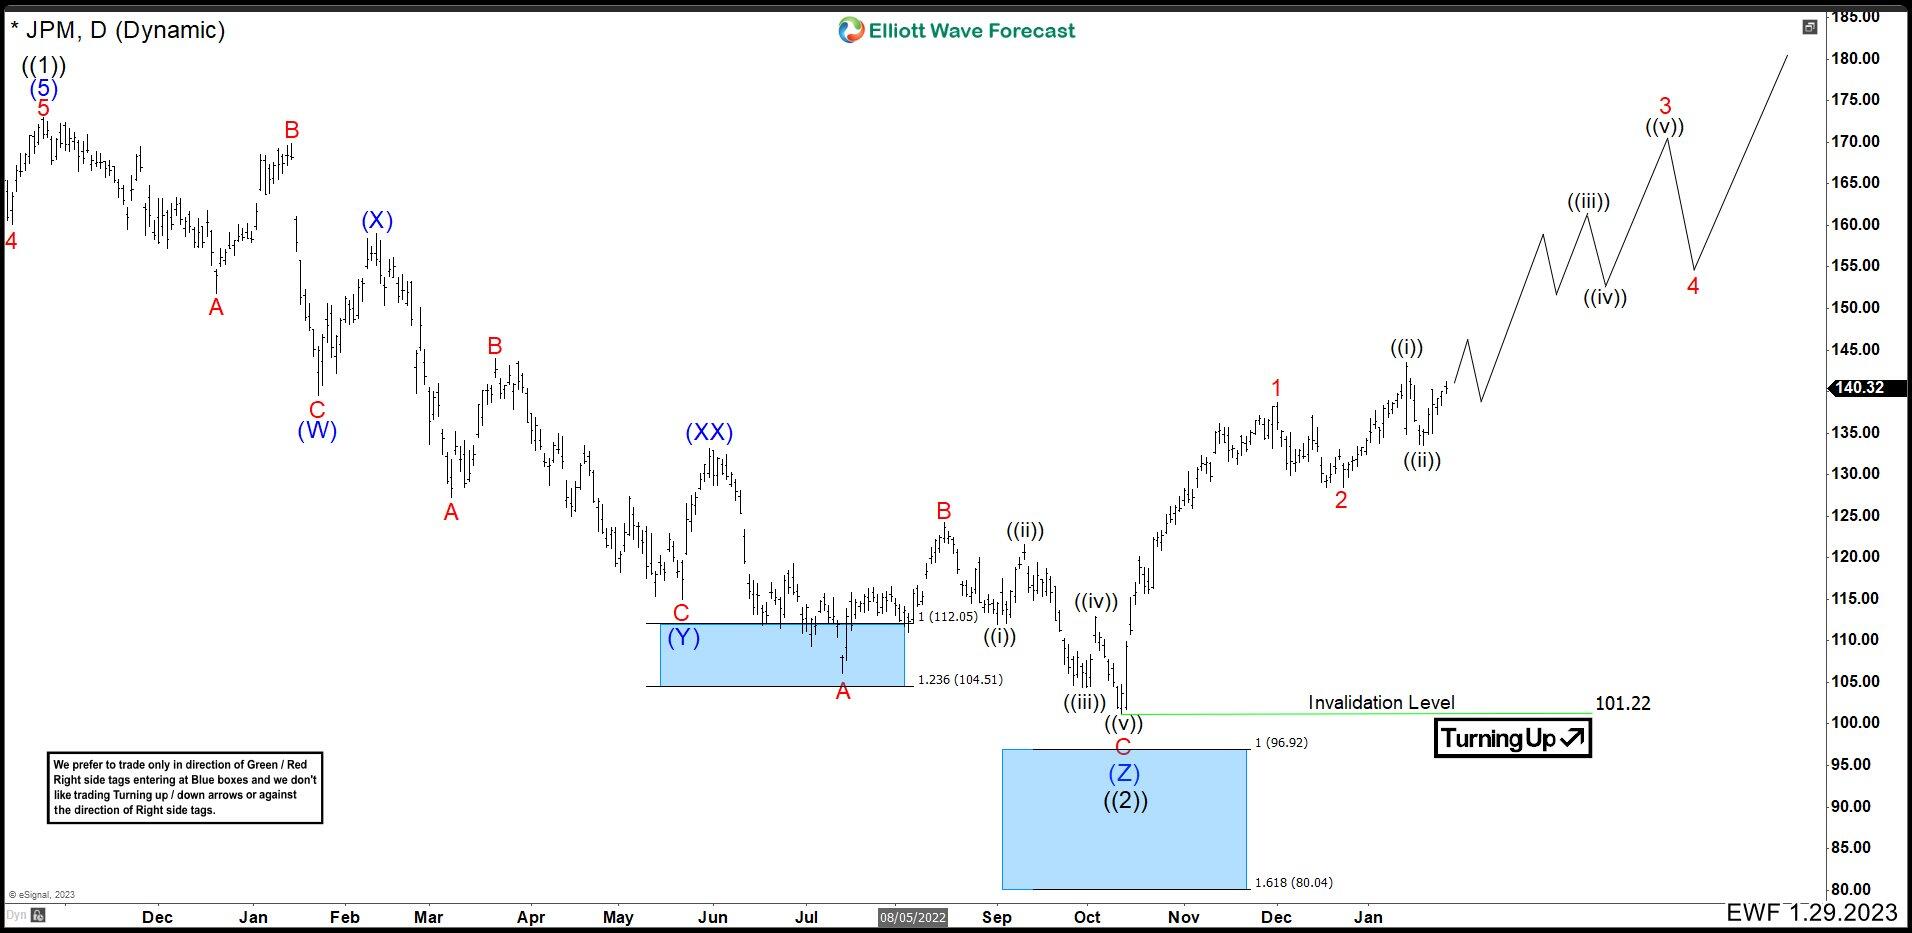
JPM went down building an impulse to complete wave C of (Z) and wave ((2)). Unfortunately, the dip did not reach the minimum target of the blue box and bounced from 101.22. Since here, the stock has gained 40% of its value and should continue to move higher. We think we must be in the middle of a new impulse. Wave 1 ended at 138.75 and corrective wave 2 at 128.24. Currently, as long as we are above 128.24, JPM should continue higher to complete wave 3.
JPM daily chart January 2023 alternative
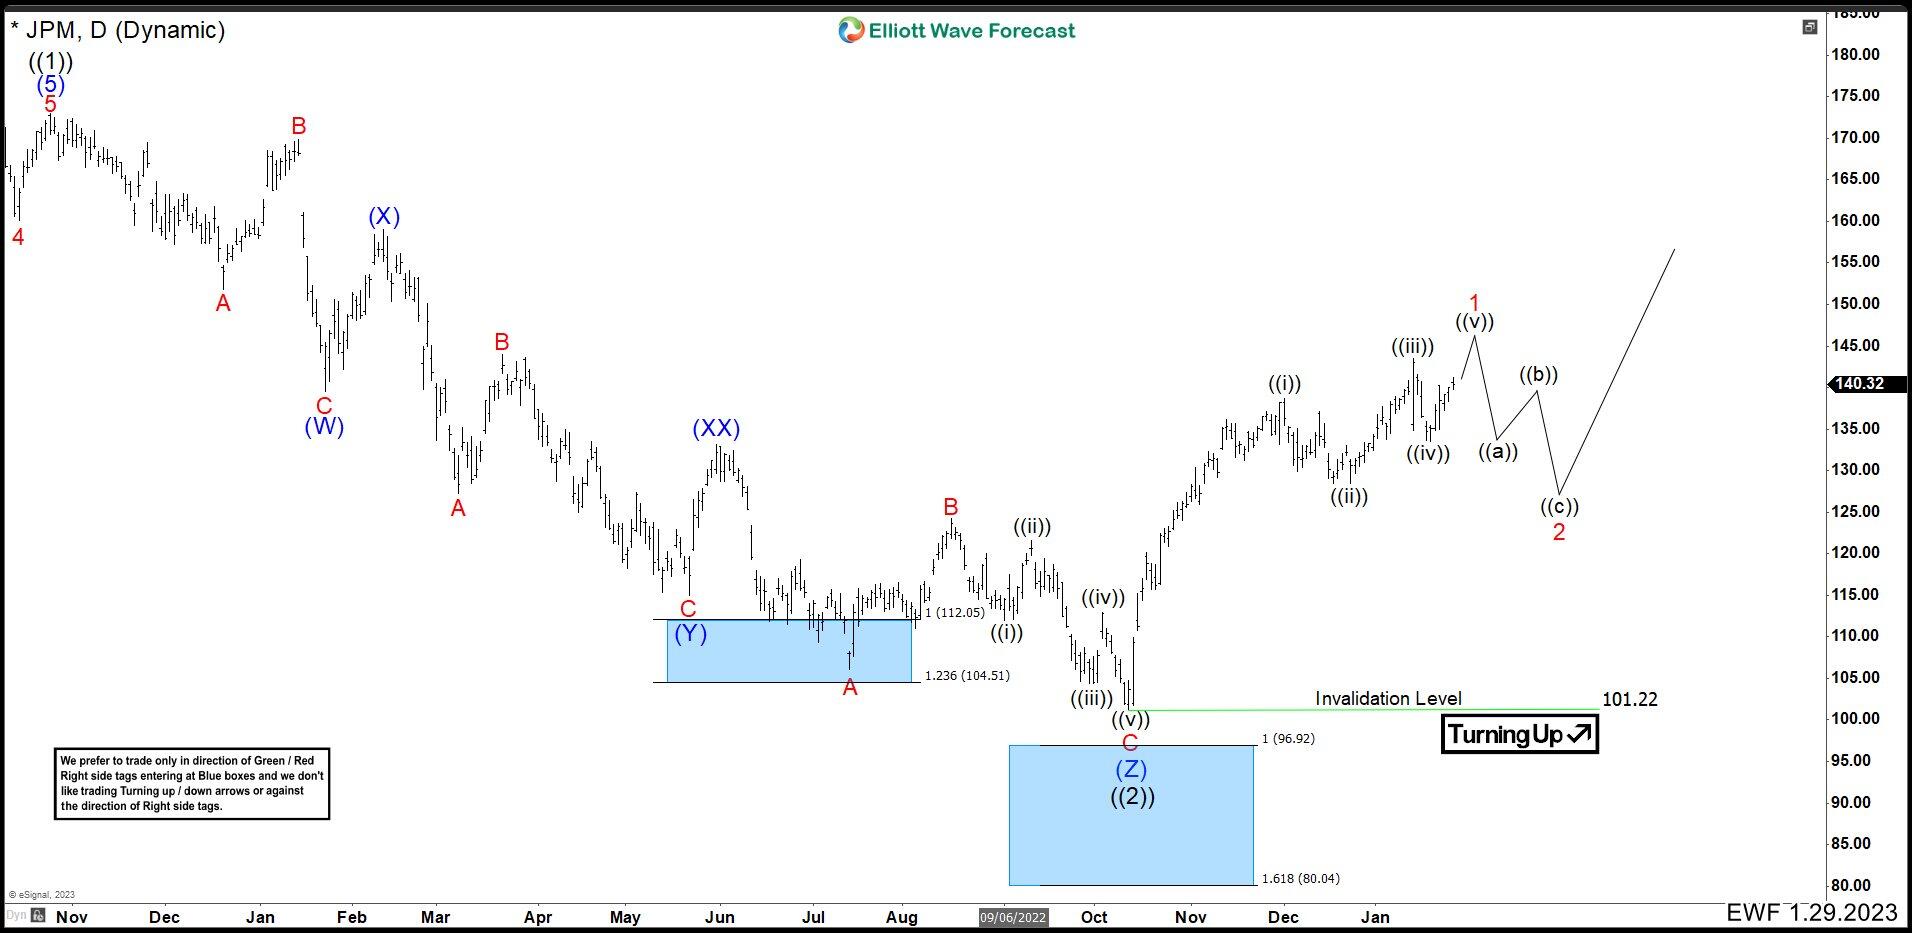
Another alternative to this new impulse, it is building a leading diagonal from 101.22 low. In this case, wave 1 would not yet be finished and with a further high it would complete wave 1. We should see this in the next month of February. If we make one more high and then break the low of the wave ((iv)), most likely it would be doing this structure shown. This would remain valid as long as wave 2 is above 101.22.
Author

Elliott Wave Forecast Team
ElliottWave-Forecast.com


