JP Morgan Chase & Co.(JPM) Elliott Wave technical analysis [Video]
![JP Morgan Chase & Co.(JPM) Elliott Wave technical analysis [Video]](https://editorial.fxstreet.com/images/TechnicalAnalysis/ChartPatterns/Candlesticks/digital-tablet-with-stock-charts-30304744_XtraLarge.jpg)
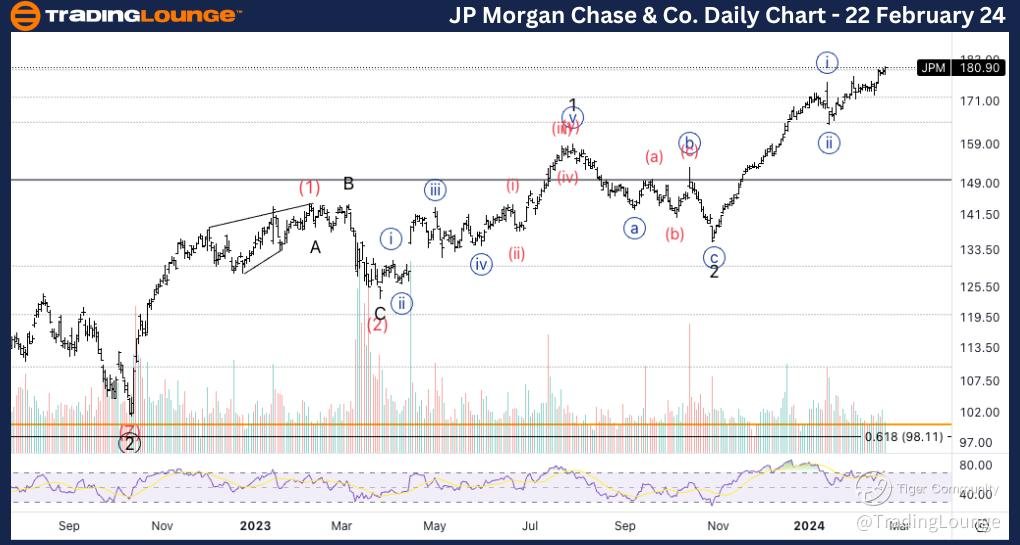
JPM Elliott Wave technical analysis
Function: Trend.
Mode: Impulsive.
Structure: Motive.
Position: Minor wave 3 of (3).
Direction: Upside in wave {iii} of 3.
Details: After a series of ones and twos around Medium Level 150, we are looking for continuation higher within wave 3 as we seem to be moving higher, with increasing volume, but a concerning RSI bearish divergence.
JPM Elliott Wave technical analysis – Daily chart
In terms of wave dynamics, we observe a dominant impulse function with a motive structure. The current position is in Minor wave 3 of (3), indicating upside momentum in wave {iii} of 3. Despite a series of consolidations around Medium Level $150, we anticipate further upside continuation within wave 3. Although we observe increasing volume, a bearish divergence in the RSI warrants attention.
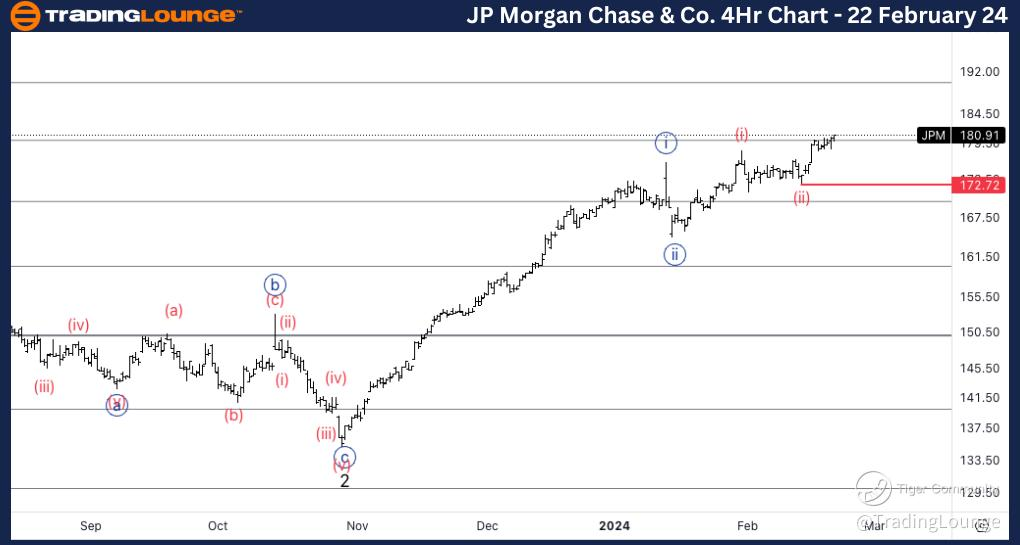
JPM Elliott Wave technical analysis
Function: Trend.
Mode: Impulsive.
Structure: Motive.
Position: Wave (iii) of {iii}.
Direction: Upside into wave {iii}.
Details: Looking for acceleration higher into wave (iii) of {iii} as if the count is correct, we should accelerate higher aggressively and a break south of 172$ would invalidate the count.
JPM Elliott Wave technical analysis – Four hour chart
Here, the wave function maintains its impulsive mode with a motive structure. The present position is in Wave (iii) of {iii}, signaling further upside movement into wave {iii}. We anticipate acceleration higher into wave (iii) of {iii}. It's important to note that a break below $172 would invalidate this count.
JPM Elliott Wave technical analysis [Video]
Author

Peter Mathers
TradingLounge
Peter Mathers started actively trading in 1982. He began his career at Hoei and Shoin, a Japanese futures trading company.


