Is the AI boom enough to outweigh Trump’s tariffs?

We had a dramatic week last week full of big news stories that triggered sudden volatility in the markets. Among the prominent headlines was the revived tariff pressure from the Trump administration, as the White House officially listed at least 26 nations whose products will be hit with US tariffs higher than 15%, with some such as Switzerland receiving rates up to 39%.
This wave of trade tension, coupled with a heavy news stream, triggered a sell-off at week's end. But markets quickly rallied, with the S&P 500 reclaiming the entire Friday loss in one daily candle. The rally appears to have been driven primarily by strong earnings from leading technology names and fresh enthusiasm about the AI bubble. Palantir, for example, reported a 48% increase in revenue and pointed to AI as a significant contributor.
Looking at how quickly the risk assets recovered, it does seem that the market is beginning to price in the chance that the economic gains from artificial intelligence would outweigh the downside of trade tensions and policy uncertainty.
Cracks beneath the surface: Is the rally lacking breadth?
Among the concerns for traders right now is market breadth. While the S&P 500 continues to print higher highs, the Advance-Decline Line (ADL) indicator is showing a lower high, as is evident below. This divergence says that fewer and fewer stocks in the rally are joining, with advances increasingly being limited to a handful of mega-cap technology names, topped by those connected to AI. Such concentrated leadership is a warning on the sustainability of the uptrend. A broader rally across financials, industrials, and small caps would signal a more robust rally. Without it, however, the index remains vulnerable to steep falls if ongoing technology-driven momentum begins to reverse.

Technical outlook: Trend remains intact but watch short-term resistance
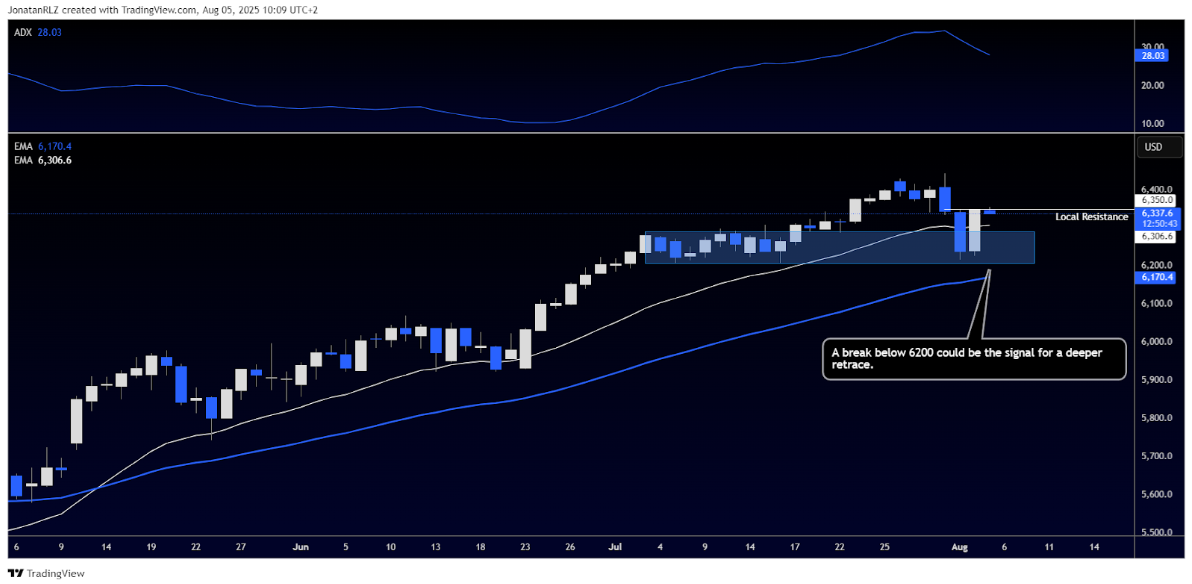
Looking at the daily chart of the S&P 500, price recently bounced off the 6,250 support area, forming a strong bullish engulfing candle on Monday that fully recovered Friday’s losses. The white 20 EMA continues to slope upward and holds well above the blue 50 EMA, signalling ongoing bullish momentum. So far, the trend structure remains intact with no clear signs of breakdown. However, the ADX at the top of the chart is starting to slope downward, suggesting a possible weakening of trend strength, though it remains above the 20 level, indicating that the trend is still active. Price is now testing initial short-term resistance around 6,350, which could act as a cap for intraday moves. A break below 6,200 would be more concerning and could signal a broader correction and possible break of structure.
Start trading with PrimeXBT
Start trading with PrimeXBT
Author

PrimeXBT Research Team
PrimeXBT
PrimeXBT is a leading Crypto and CFD broker that offers an all-in-one trading platform to buy, sell and store Cryptocurrencies and trade over 100 popular markets, including Crypto Futures, Copy Trading and CFDs on Crypto, Forex, I


