Intel (INTC) weekly topping tail, struggling trendline, and a stock at a crossroads

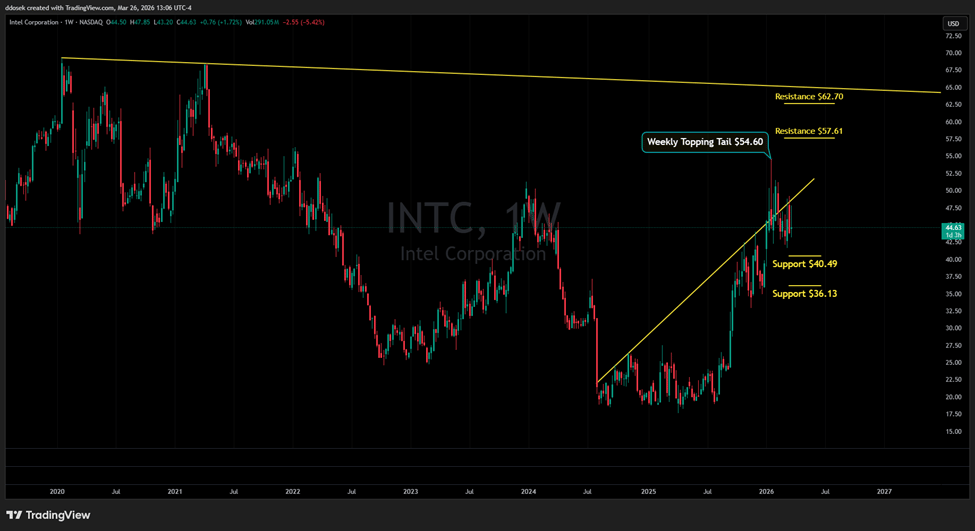
Intel printed a weekly topping tail at $54.60, and price has since dropped 18% to $44.57. Now INTC is trapped beneath a critical inclining trendline. Break above it and the topping tail is back in play. Fail here and $40.49 is the next stop.
Intel Corporation (NASDAQ: INTC) is one of the world's largest semiconductor companies, designing and manufacturing microprocessors, chipsets, and integrated circuits used across personal computers, data centers, and a growing range of connected devices. After years of competitive challenges and a brutal multi-year decline, INTC staged a meaningful recovery off its 2025 lows — but a significant technical warning signal has emerged on the weekly chart that investors cannot afford to overlook.
The weekly topping tail: A hard pattern to overcome
During the recent consolidation period that began at the end of 2025, INTC registered a weekly topping tail with its high reaching $54.60. Unlike a daily topping tail, a weekly topping tail carries far greater weight. It represents an entire week of price action where buyers pushed aggressively higher, only to be completely overwhelmed by sellers before the weekly close. This pattern is broadly bearish and historically difficult for price to overcome without first experiencing a meaningful drawdown.
True to form, INTC has since declined approximately 18% from that topping tail high, with price currently trading at $44.63. While the pullback has been significant, it has created an interesting setup where INTC has potentially drawn down enough to build the energy needed to take another run at the topping tail level. But that only applies if it can first clear a critical obstacle.
The inclining trendline: The immediate gatekeeper
The most pressing technical challenge for INTC right now is the inclining trendline that has consistently acted as both support and resistance throughout the recent consolidation. Price is currently struggling to maintain above this trendline, trading in the lower range of the consolidation zone. This is the near-term line in the sand. Until INTC can establish itself cleanly above this trendline on a weekly closing basis, the path of least resistance remains to the downside.
Two scenarios, two very different outcomes
The Bull Case: If INTC can reclaim and hold above the inclining trendline, the resistance levels to target are:
● $54.60 — The weekly topping tail high and the first major hurdle. Clearing this level on a weekly close would be a significant technical achievement.
● $57.61 — The next resistance zone above the topping tail.
● $62.70 — The longer-term declining trendline from the 2020-2021 highs, representing the most significant overhead resistance on the weekly chart.
The Bear Case: If the consolidation fails and INTC breaks down through the inclining trendline, the support levels to monitor are:
● $40.49 — The first support level and the most likely initial target on a breakdown.
● $36.13 — Deeper support and a level that aligns with prior price memory from the 2025 base-building period.
The bottom line
INTC sits at a genuine crossroads. The 18% pullback from the weekly topping tail has reset conditions enough to give the bulls a fighting chance, but the inclining trendline must be reclaimed with conviction. Watch weekly closes carefully — this is not a stock to trade on intraday noise. The weekly chart is telling the story, and right now that story is unresolved.
Author

Drew Dosek
Verified Investing
Passionate technical and cycle analyst committed to empowering traders through data-driven insights.


