Indian Rupee opens flat, awaits US-Iran talks in Oman
- The Indian Rupee trades calmly near 94.35 against the US Dollar ahead of US-Iran talks, NFP data.
- Iran stresses the recognition of its authority near the Strait of Hormuz.
- The Fed is expected to deliver at least one interest rate hike this year.
The Indian Rupee (INR) opens on a flat note against the US Dollar (USD) after a long weekend on Monday. The USD/INR pair wobbles around 94.35 as investors await the outcome of talks between the United States (US) and Iran, scheduled on Tuesday in Oman, regarding peace near the Strait of Hormuz, a critical chokepoint to almost one-fifth of global energy supply.
US-Iran agree on a ceasefire after trading attacks over weekend
The exchange of attacks between the US and Iran near the Strait of Hormuz over the weekend renewed fears of a global energy supply disruption again. Comments from Iran’s Foreign Minister Abbas Araghchi signaled that Tehran’s attacks were meant to demonstrate its intentions to have authority over the Hormuz.
Iran’s Foreign Minister Araghchi said that responsibility for the Strait of Hormuz lies solely with Tehran and warned that any attempt to bypass its preferred route in the waterway will cause “tension and escalation”. However, both nations later agreed on a ceasefire and scheduled talks regarding the same in Oman for Tuesday.
Market participants worry that signs of renewed conflicts between the two nations could lift oil prices again, which have returned close to their pre-war levels, a scenario that diminishes the appeal of currencies from economies, such as India, which rely heavily on oil imports to meet their energy needs.
US Dollar consolidates at start of US NFP week
The US Dollar Index, which gauges the Greenback’s value against six major currencies, trades calmly near 101.30. Investors seem to have sidelined, awaiting a slew of US data, especially the Nonfarm Payrolls (NFP) data for June, which will be released on Thursday.
Investors will pay close attention to the US NFP data for fresh cues regarding the Federal Reserve’s (Fed) monetary policy outlook. The impact of the official employment data will be significant as comments from new Fed Chairman Kevin Warsh in his monetary policy conference this month signaled that forward-looking statements from the central bank would be restricted in the current policy conjuncture.
According to the CME FedWatch tool, the odds of the Fed delivering at least one interest rate hike this year are almost 90%.
This week, investors will also focus on the US ISM Manufacturing and Services PMI and the ADP Employment Change data for June, and the JOLTS Job Openings data for May.
Technical Analysis: USD/INR trades inside Descending Triangle formation
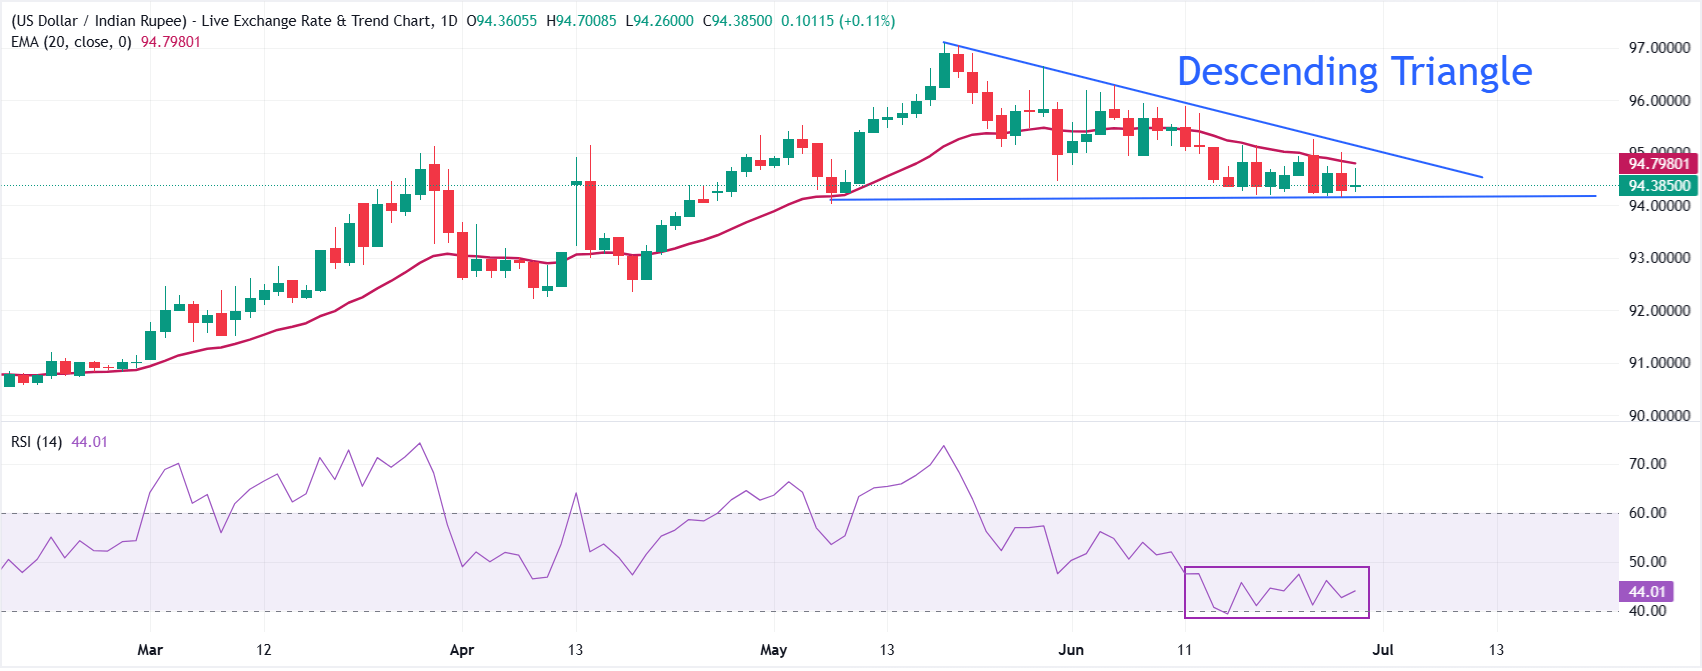
USD/INR trades flat at around 94.38, keeping a bearish near-term tone as spot holds below the 20-period exponential moving average (EMA) at 94.7980 and under the broader downward resistance trend line of the Descending Triangle formation starting near 97.1042.
The pair has been sliding off recent highs and now trades closer to its rising support line from 94.1051, while the Relative Strength Index (14) around 44 suggests waning bullish momentum and leaves the door open for further downside pressure.
On the topside, initial resistance is defined by the 20-period EMA at 94.7980, with a subsequent barrier coming from the longer-term descending trend line near 97.1042. On the downside, the immediate focus is on the horizontal support line drawn from 94.1051, with the current price area around 94.3850 acting as a pivotal zone where a sustained break lower would reinforce the bearish bias and expose deeper losses in the coming sessions.
(The technical analysis of this story was written with the help of an AI tool.)
Indian Rupee FAQs
The Indian Rupee (INR) is one of the most sensitive currencies to external factors. The price of Crude Oil (the country is highly dependent on imported Oil), the value of the US Dollar – most trade is conducted in USD – and the level of foreign investment, are all influential. Direct intervention by the Reserve Bank of India (RBI) in FX markets to keep the exchange rate stable, as well as the level of interest rates set by the RBI, are further major influencing factors on the Rupee.
The Reserve Bank of India (RBI) actively intervenes in forex markets to maintain a stable exchange rate, to help facilitate trade. In addition, the RBI tries to maintain the inflation rate at its 4% target by adjusting interest rates. Higher interest rates usually strengthen the Rupee. This is due to the role of the ‘carry trade’ in which investors borrow in countries with lower interest rates so as to place their money in countries’ offering relatively higher interest rates and profit from the difference.
Macroeconomic factors that influence the value of the Rupee include inflation, interest rates, the economic growth rate (GDP), the balance of trade, and inflows from foreign investment. A higher growth rate can lead to more overseas investment, pushing up demand for the Rupee. A less negative balance of trade will eventually lead to a stronger Rupee. Higher interest rates, especially real rates (interest rates less inflation) are also positive for the Rupee. A risk-on environment can lead to greater inflows of Foreign Direct and Indirect Investment (FDI and FII), which also benefit the Rupee.
Higher inflation, particularly, if it is comparatively higher than India’s peers, is generally negative for the currency as it reflects devaluation through oversupply. Inflation also increases the cost of exports, leading to more Rupees being sold to purchase foreign imports, which is Rupee-negative. At the same time, higher inflation usually leads to the Reserve Bank of India (RBI) raising interest rates and this can be positive for the Rupee, due to increased demand from international investors. The opposite effect is true of lower inflation.
Author

Sagar Dua
FXStreet
Sagar Dua is associated with the financial markets from his college days. Along with pursuing post-graduation in Commerce in 2014, he started his markets training with chart analysis.