|

Insurance Australia Group Limited – IAG stock analysis and Elliott wave technical forecast [Video]

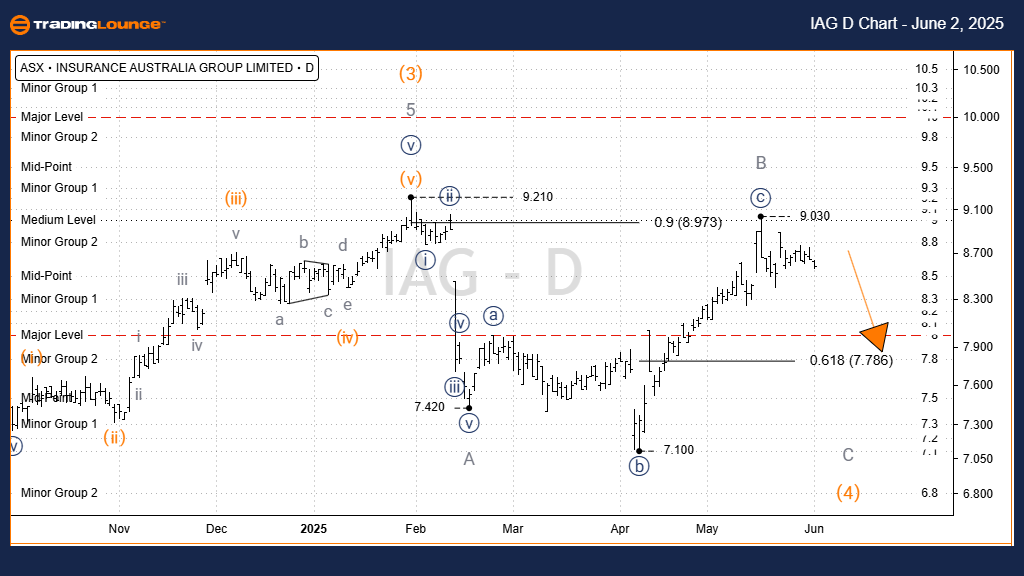
ASX: Insurance Australia Group Limited – IAG Elliott Wave technical analysis (One-day chart)

Function: Major trend (Minor degree, grey).

Mode: Motive.

Structure: Impulse.

Position: Wave C-grey.

Details:

  • Wave 3-orange has concluded as a five-wave sequence.

  • Wave 4-orange is unfolding downward as a Zigzag labeled A, B, C-grey.

  • Wave A-grey has completed.

  • Wave B-grey likely completed as an Expanded Flat.

  • Wave C-grey is expected to push lower, targeting the 7.79 level.

Invalidation point: 9.03.

Chart

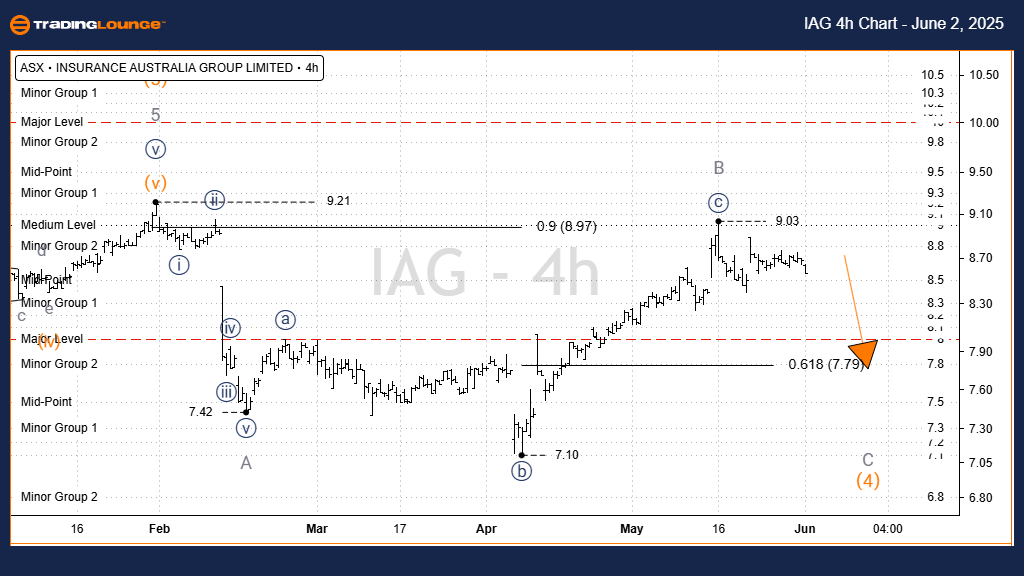
ASX: Insurance Australia Group Limited – IAG Elliott Wave technical analysis (Four-hour chart)

Function: Major trend (Minor degree, grey).

Mode: Motive.

Structure: Impulse.

Position: Wave C-grey.

Details:

  • A-grey and B-grey waves have completed.

  • Since the 9.03 high, a decline is anticipated with the C-grey wave.

  • The nearest target is 7.79, with potential further movement to 7.42–7.10.

  • Price must remain below 9.03 to maintain this outlook.

IAG

Conclusion

Our analysis and short-term forecast for ASX: INSURANCE AUSTRALIA GROUP LIMITED – IAG aim to provide insights into current market trends and effective strategies. Specific price points serve as validation or invalidation signals for our wave count, enhancing confidence in our perspective. By combining these factors, we strive to offer an objective and professional view of market trends.

Insurance Australia Group Limited – IAG stock analysis and Elliott wave technical forecast [Video]

Author

Peter Mathers

Peter Mathers

TradingLounge

Peter Mathers started actively trading in 1982. He began his career at Hoei and Shoin, a Japanese futures trading company.

More from Peter Mathers
Share:

Markets move fast. We move first.

Orange Juice Newsletter brings you expert driven insights - not headlines. Every day on your inbox.

By subscribing you agree to our Terms and conditions.

Editor's Picks

EUR/USD clings to gains above 1.1700

Following the correction seen in the second half of the previous week, EUR/USD gains traction to start the new week and trades in positive territory above 1.1700. The US Dollar (USD) struggles to attract buyers as investors await Tuesday's GDP data ahead of the Christmas holiday. 

GBP/USD rises above 1.3400 on renewed USD weakness

GBP/USD turns north on Monday and trades in positive territory above 1.3400. The US Dollar (USD) stays on the back foot to begin the new week as investors adjust their positions before tomorrow's growth data, helping the pair stretch higher.

Gold hits new record-high above $4,400 as geopolitical tensions escalate

Gold trades at a fresh all-time-high above $4,400 Monday, rising more than 1.5% on a daily basis. The potential for a re-escalation of the tensions in the Middle East on news of Israel planning to attack Iran allows Gold to capitalize on safe-haven flows.

Bitcoin, Ethereum and Ripple eye breakout for fresh recovery

Bitcoin, Ethereum, and Ripple are approaching key technical levels at the time of writing on Monday as the broader crypto market stabilizes. Market participants are closely watching whether BTC, ETH, and XRP can sustain breakouts and achieve decisive daily closes above nearby resistance levels, which could signal the start of a short-term recovery.

Ten questions that matter going into 2026

2026 may be less about a neat “base case” and more about a regime shift—the market can reprice what matters most (growth, inflation, fiscal, geopolitics, concentration). The biggest trap is false comfort: the same trades can look defensive… right up until they become crowded.

Hyperliquid price forecast: Bullish interest builds amid user recovery

Hyperliquid (HYPE) trades at $25 at press time on Monday, holding the 3% gains from the previous day. The perpetual exchange sees a recovery in active users, while weekly fees collected decline to the lowest level so far this month.