|

Indraprastha Gas Ltd (IGL): Bullish Elliott Wave outlook

Indraprastha Gas Ltd (IGL) Shows a Promising Elliott Wave Setup, Indicating a Strong Bullish Trend with Clear Invalidation Levels

Indraprastha Gas Ltd (IGL) displays a promising long-term bullish setup from an Elliott Wave perspective. The price action shows a clear impulsive structure over the years, supported by corrective phases that align with Elliott Wave principles. Below is an analysis of the chart to provide clarity on the current and future trajectory.

Primary Elliott Wave analysis

IGL has been progressing in a five-wave primary cycle since its inception. The initial cycle marked as Wave I concluded near 2010, followed by a corrective Wave II. This Wave II was a complex correction, setting the foundation for an explosive Wave III. True to Elliott Wave theory, Wave III extended significantly, demonstrating strong momentum and breaking to higher levels. Wave IV then followed, forming a corrective phase with more subdued price action. This was consistent with the guideline that fourth waves often form sideways or complex corrections compared to the sharper Wave II. Finally, Wave V completed the larger primary impulse cycle, pushing IGL to a significant high.

Chart

Current structure and outlook

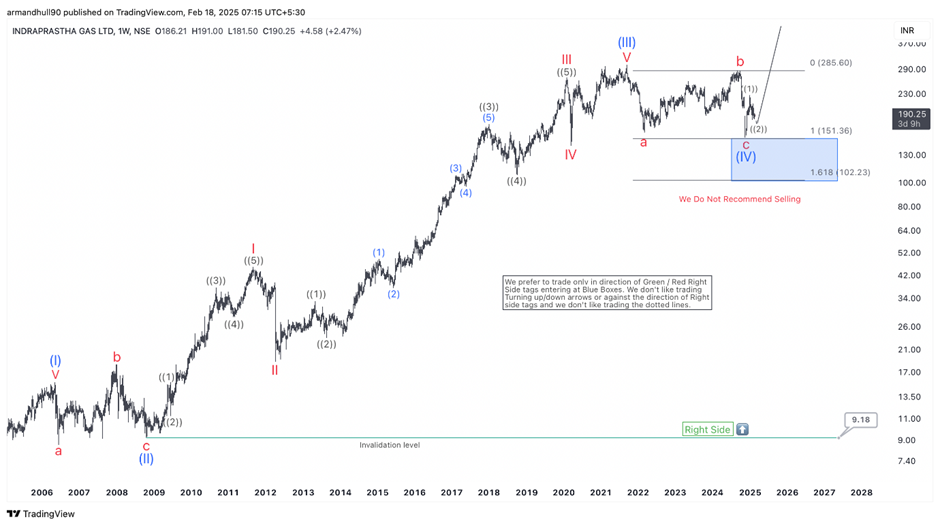
The recent correction appears to be part of a larger degree Wave (IV), completing a flat correction labeled as a-b-c. Wave c of (IV) terminated near a critical support level at INR 151.88 within the blue box and found buyers in that area. A strong upward reaction from this zone signals the beginning of Wave (V). Wave (V) is expected to unfold impulsively, targeting new all-time highs. The bullish structure remains valid as long as the price stays above the invalidation level. Early signs of Wave ((1)) within (V) are emerging, confirming the resumption of the uptrend.

We prefer trading in the direction of the green Right Side tags, aligning with the higher-degree bullish trend. The blue box area offered an ideal long entry for aggressive traders, while conservative participants may wait for additional confirmations such as a break of the b-wave high. Importantly, we do not recommend selling against the prevailing trend.

Author

Elliott Wave Forecast Team

Elliott Wave Forecast Team

ElliottWave-Forecast.com

More from Elliott Wave Forecast Team
Share:

Markets move fast. We move first.

Orange Juice Newsletter brings you expert driven insights - not headlines. Every day on your inbox.

By subscribing you agree to our Terms and conditions.

Editor's Picks

EUR/USD bears await break below 100-day SMA support near 1.1665 area

The EUR/USD pair attracts heavy selling for the second straight day and dives to a nearly four-week trough, around the 1.1670 region, during the Asian session on Monday. Bearish traders now await a sustained break below the 100-day Simple Moving Average before positioning for an extension of the recent pullback from a three-month top, or levels just above the 1.1800 mark touched on December 24.

GBP/USD falls toward 1.3400 near 50-day EMA

GBP/USD extends its losses for the second successive session, trading around 1.3420 during the Asian hours on Monday. The technical analysis of the daily chart indicates that the 14-day Relative Strength Index at 53 has eased from near overbought, indicating that momentum has cooled while remaining above the midline. RSI holds above 50, keeping a modest bullish bias.

Gold on fire at the start of the week on US-Venezuela tensions

Gold regains upside traction early Monday as flight to safety prevails on Venezuela turmoil. The US Dollar finds strong haven demand, caps Gold’s upside as focus shifts to US jobs data. Gold’s daily technical setup suggests that more upside remains in the offing.

Bulls firmly in control as Bitcoin breaks $93K, Ethereum and Ripple extend gains

Bitcoin, Ethereum, and Ripple extended their rallies on Monday, gaining more than 4%, 6%, and 12%, respectively, in the previous week. The top three cryptocurrencies by market capitalization could continue to outperform, with bulls in control of the momentum.

Economic outlook 2026-2027 in advanced countries: Solidity test

After a year marked by global economic resilience and ending on a note of optimism, 2026 looks promising and could be a year of solid economic performance. In our baseline scenario, we expect most of the supportive factors at work in 2025 to continue to play a role in 2026.

Meme Coins Price Prediction: Dogecoin, Shiba Inu, Pepe rally on Venezuela’s shadow BTC reserve

Meme coins such as Dogecoin, Shiba Inu, and Pepe are leading the cryptocurrency market rally driven by the US cross-border operation to capture Venezuelan President Nicolás Maduro. Dogecoin extends its gain for the fifth consecutive day while SHIB and PEPE take a pause.