Indian Rupee remains supported against US Dollar due to lower Oil prices
- The Indian Rupee remains in a tight range against the US Dollar despite the latter outperformance.
- Lower Oil prices continue to limit the downside in the Indian Rupee.
- FIIs turned out to be net sellers on Monday.
The Indian Rupee (INR) trades subduedly against the US Dollar (USD) on Tuesday. The USD/INR pair has struggled for direction for two weeks, trading close to 94.60, while the US Dollar gains amid caution surrounding the United States (US) Nonfarm Payrolls (NFP) data for June, which will be released on Thursday.
At press time, the US Dollar Index (DXY), which gauges the Greenback’s value against six major currencies, trades 0.2% higher to near 101.32.
US Dollar Price Today
The table below shows the percentage change of US Dollar (USD) against listed major currencies today. US Dollar was the strongest against the Japanese Yen.
| USD | EUR | GBP | JPY | CAD | AUD | INR | CHF | |
|---|---|---|---|---|---|---|---|---|
| USD | 0.21% | 0.18% | 0.24% | 0.18% | 0.03% | 0.03% | 0.20% | |
| EUR | -0.21% | -0.03% | 0.02% | -0.08% | -0.20% | -0.10% | -0.02% | |
| GBP | -0.18% | 0.03% | 0.04% | -0.03% | -0.15% | -0.18% | 0.01% | |
| JPY | -0.24% | -0.02% | -0.04% | -0.07% | -0.22% | -0.13% | -0.06% | |
| CAD | -0.18% | 0.08% | 0.03% | 0.07% | -0.17% | -0.05% | 0.02% | |
| AUD | -0.03% | 0.20% | 0.15% | 0.22% | 0.17% | 0.10% | 0.18% | |
| INR | -0.03% | 0.10% | 0.18% | 0.13% | 0.05% | -0.10% | 0.07% | |
| CHF | -0.20% | 0.02% | -0.01% | 0.06% | -0.02% | -0.18% | -0.07% |
The heat map shows percentage changes of major currencies against each other. The base currency is picked from the left column, while the quote currency is picked from the top row. For example, if you pick the US Dollar from the left column and move along the horizontal line to the Japanese Yen, the percentage change displayed in the box will represent USD (base)/JPY (quote).
US NFP to be key trigger for global markets
The US NFP data always holds significant importance for the Federal Reserve’s (Fed) interest rate expectations. However, this time, its impact is expected to be higher as remarks from new Fed Chairman Kevin Warsh in his monetary policy conference this week showed that he would refrain from delivering forward-looking statements.
“Absent, also, is so-called forward guidance—which we agreed was not well suited to the current policy conjuncture,” according to the transcript of Fed Chairman Warsh’s Press Conference.
According to estimates, the US economy created 110K fresh jobs, lower than 172K in May. The Unemployment Rate remains steady at 4.3%.
In Tuesday’s session, investors will focus on the US JOLTS Job Openings data for May, which will be published at 14:00 GMT. The data is expected to show that employers posted 7.3 million fresh jobs, lower than 7.618 million in April.
This week, investors will also focus on the US ADP Employment Change and the ISM Manufacturing PMI data for June, which will be released on Wednesday.
Lower oil prices continue to offer support to Indian Rupee
Oil prices remaining lower due to the maintenance of a ceasefire between the US and Iran continue to support the Indian Rupee.
Currencies from economies, such as India, which rely heavily on oil imports to meet their energy needs, tend to outperform when oil prices remain lower.
Meanwhile, Iran continues to demand recognition of its authority near the Strait of Hormuz, a critical chokepoint to almost 20% of global energy supply, for which it is in talks with Oman.
On Monday, Iranian Deputy Foreign Minister Kazem Gharibabadi stated in a post on X, formerly known as Twitter, that Tehran has concluded a meeting with Oman in which it reviewed current issues related to the Hormuz, and also exchanged views on the future management of the waterway.
FIIs remain net sellers in Indian stock market on Monday
Foreign Institutional Investors (FIIs) continue to pare their stake in the Indian stock market even as lower oil prices have improved India Inc.’s earnings projections. On Monday, FIIs remained net sellers, offloading their stake worth Rs. 1,350.10 crore.
Technical Analysis: USD/INR trades inside Descending Triangle pattern
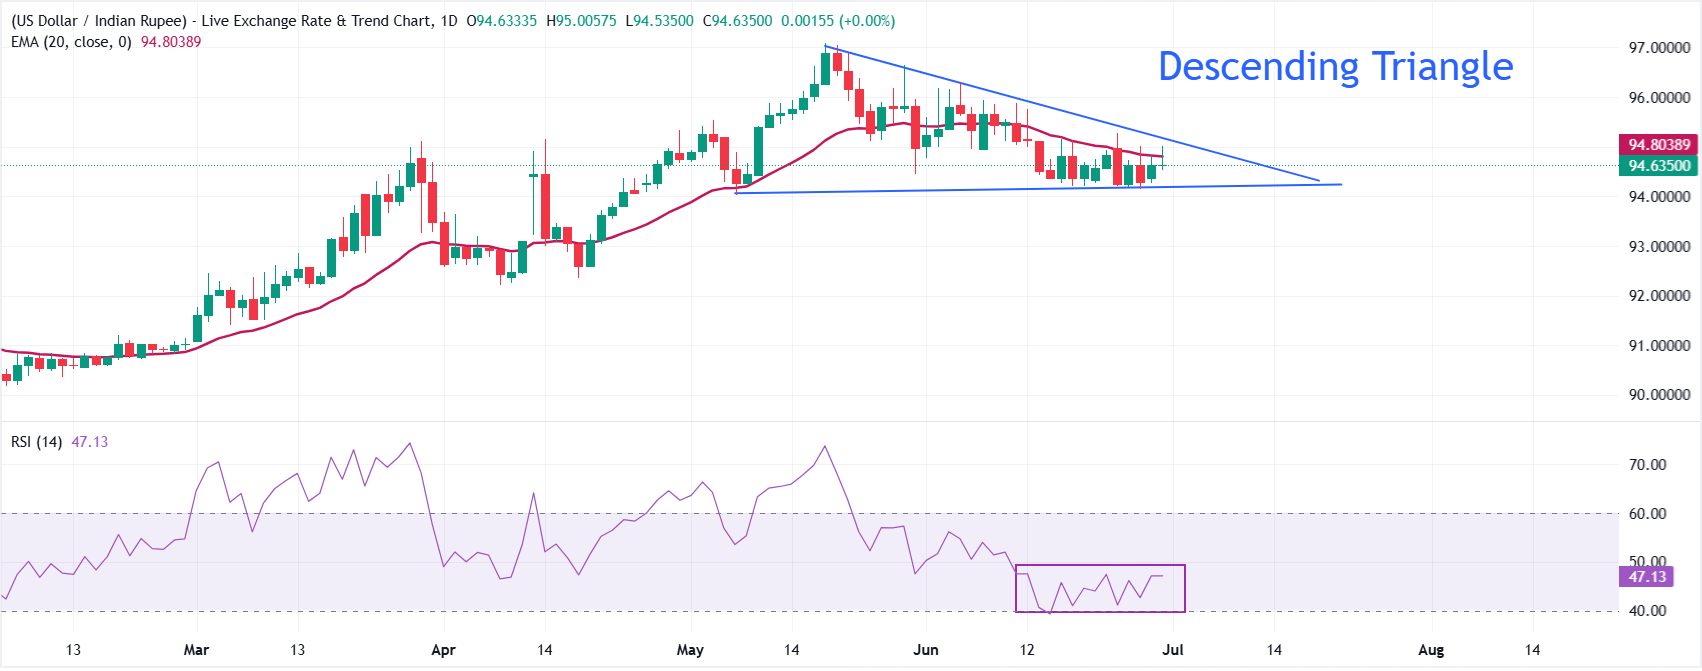
USD/INR trades at around 94.65, keeping a bearish near-term tone as it holds beneath the 20-period Exponential Moving Average (EMA) at 94.80 and the downward-sloping border of the Descending Triangle formation, whose break level sits at 95.18.
The exchange rate has slipped back into the lower half of the recent range, while the Relative Strength Index (RSI) at 47 suggests neutral-to-soft momentum rather than outright oversold conditions, hinting that downside pressure persists but without capitulation.
On the topside, immediate resistance is seen at the 20-period EMA at 94.80, followed by the downtrend-line break level at 95.1822, with the origin of that bearish line near 97.0285 acting as a more distant cap. On the downside, the horizontal border of the above-mentioned chart pattern at around 94.00 is the key support zone; a break below that would expose the pair to the April 15 high at 93.47.
(The technical analysis of this story was written with the help of an AI tool.)
Author

Sagar Dua
FXStreet
Sagar Dua is associated with the financial markets from his college days. Along with pursuing post-graduation in Commerce in 2014, he started his markets training with chart analysis.
















