Indian Rupee slides to fresh all-time lows against US Dollar
- The Indian Rupee slides to a fresh all-time low against the US Dollar, with the USD/INR jumping to near 95.60.
- US-Iran renewed tensions prompt fears of a prolonged Hormuz closure.
- India's CPI grew at an annualized pace of 3.48% in April, misses 3.8% estimates.

The Indian Rupee (INR) slumps to a fresh all-time low against the US Dollar (USD) on Tuesday. The USD/INR pair jumps to near 95.63 as renewed tensions between the United States (US) and Iran have prompted fears of a prolonged closure of the Strait of Hormuz, a critical passage for almost 20% of global energy supply.
The continuation of the Hormuz closure is favorable for oil prices, a scenario that bodes poorly for currencies from economies, such as India, which rely heavily on oil imports to meet their energy needs. As of writing, the WTI Oil price trades flat, slightly below $96.00.
US President Trump dismisses Iran's counterproposal
US President Donald Trump clarified on Monday that the counterproposal delivered by Iran against the one-page peace proposal was a “stupid proposal” and lacked Tehran’s decision on pursuing its nuclear ambitions. Trump added, “Ceasefire is on life support.”
Meanwhile, a report from CNN has stated that US President Trump has grown increasingly frustrated with how the Iranians are handling talks to end the conflict, and some Trump aides say that he is now more seriously considering a resumption of major combat operations than he has in recent weeks. This has renewed fears of a resumption of massacres in the Middle East.
FIIs selling spree remains intact
Amidst uncertainty surrounding India Inc.’s earnings projections due to elevated oil prices, foreign investors continue to dump their stake in the Indian stock market. So far in May, Foreign Institutional Investors (FIIs) have remained net sellers in five of six trading days and have offloaded their stake worth Rs. 19,509.91 crore.
India's CPI rises moderately
India's Consumer Price Index (CPI) data for April has come in lower than projected. The retail inflation data arrives at 3.48% Year-on-Year (YoY), misses 3.8% estimates, but increased from 3.4% in March.
Later in the day, investors will focus on the US CPI data for April, which will be published at 12:30 GMT. The US headline inflation is estimated to have accelerated to 3.7% from the previous reading of 3.3%.
Investors will pay close attention to US inflation data to get fresh cues regarding the Federal Reserve’s (Fed) monetary policy outlook.
US President Trump’s visit to China also strengthens USD/INR
An improvement in the safe-haven demand of the US Dollar in the wake of renewed US-Iran tensions has also strengthened the USD/INR pair. As of writing, the US Dollar Index (DXY) trades 0.35% higher to near 98.25.
This week, the major trigger for global markets will be the bilateral meeting between US President Trump and Chinese leader Xi Jinping during Trump’s visit from May 13-15. Both leaders are expected to discuss mainly the Middle East situation, Taiwan, Artificial Intelligence (AI), and rare-earth elements.
Technical Analysis: USD/INR remains firm above 20-day EMA
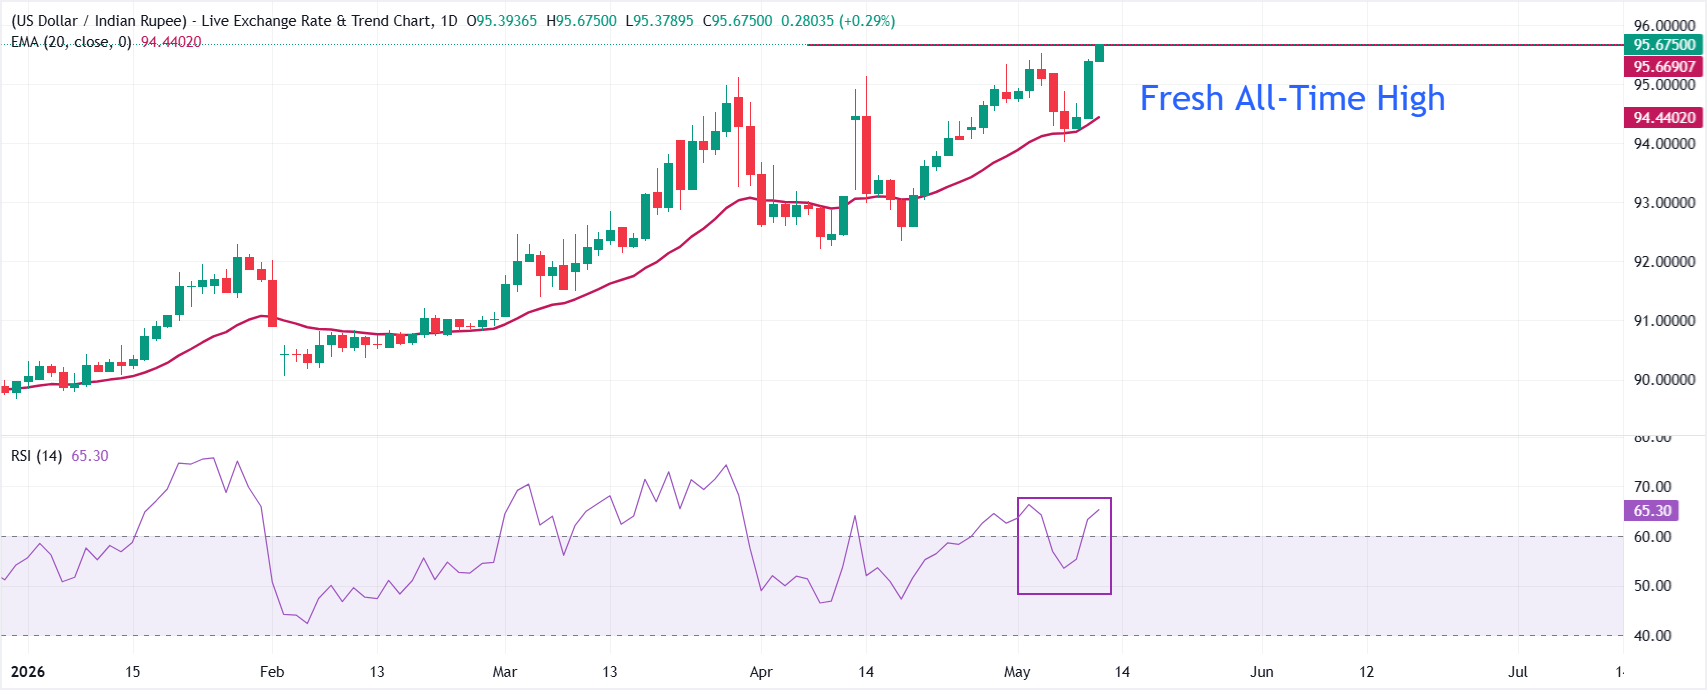
USD/INR trades higher at around 95.60, extending a bullish bias as price holds above the 20-day exponential moving average (EMA) at 94.4221. The pair is pressing fresh highs within the recent sequence of higher closes, while the Relative Strength Index (RSI) near 64 points to firm but not yet overbought upside momentum, suggesting dips may continue to attract buying interest as long as the exchange rate remains supported above the short-term EMA.
Looking up, the pair is in uncharted territory and will likely extend its advance toward 96.00. On the downside, the 20-day EMA at 94.42 will act as dynamic support; a daily close below that would lead to further correction toward 94.00.
(The technical analysis of this story was written with the help of an AI tool.)
Economic Indicator
Consumer Price Index (YoY)
Inflationary or deflationary tendencies are measured by periodically summing the prices of a basket of representative goods and services and presenting the data as The Consumer Price Index (CPI). CPI data is compiled on a monthly basis and released by the US Department of Labor Statistics. The YoY reading compares the prices of goods in the reference month to the same month a year earlier.The CPI is a key indicator to measure inflation and changes in purchasing trends. Generally speaking, a high reading is seen as bullish for the US Dollar (USD), while a low reading is seen as bearish.
Read more.Next release: Tue May 12, 2026 12:30
Frequency: Monthly
Consensus: 3.7%
Previous: 3.3%
Source: US Bureau of Labor Statistics
The US Federal Reserve (Fed) has a dual mandate of maintaining price stability and maximum employment. According to such mandate, inflation should be at around 2% YoY and has become the weakest pillar of the central bank’s directive ever since the world suffered a pandemic, which extends to these days. Price pressures keep rising amid supply-chain issues and bottlenecks, with the Consumer Price Index (CPI) hanging at multi-decade highs. The Fed has already taken measures to tame inflation and is expected to maintain an aggressive stance in the foreseeable future.
Author

Sagar Dua
FXStreet
Sagar Dua is associated with the financial markets from his college days. Along with pursuing post-graduation in Commerce in 2014, he started his markets training with chart analysis.
















