Indian Rupee gains on reviving enegry flows through Hormuz
- The Indian Rupee trades higher against the US Dollar as oil prices fall further.
- RBI Governor Malhotra pushes back fears of interest rate hikes.
- The US Dollar ticks lower ahead of the US PCE Inflation data for May.

The Indian Rupee (INR) trades firmly against the US Dollar (USD) on Thursday. The USD/INR pair declines to near 94.30 as the Indian currency strengthens due to a further decline in oil prices.
The WTI Oil price has returned close to the pre-Middle East war levels as traffic through the Strait of Hormuz, a critical chokepoint to almost 20% of global energy supply, has started normalizing, following the Memorandum of Understanding (MoU) signing and an improvement in technical talks towards the nuclear deal between the United States (US) and Iran.
At press time, the WTI Oil price trades 0.75% lower to near $69.25. The MCX Crude Oil contract expiring on July 20 is down 1.6% to near 6,563.
Currencies from economies, such as India, which rely heavily on oil imports to meet their energy needs, appreciate when oil prices fall significantly.
One Reserve Bank of India (RBI) rate-setting member has stated that the Indian economy could outpace the central bank's growth rate forecast of 6.6% and rise by 7% if oil prices continue to remain lower near $70.00, Bloomberg reported.
Slightly lower US Dollar also acts as drag on USD/INR
In the Asian session, the US Dollar demonstrates a subdued performance while investors await the US Personal Consumption Expenditure Price Index (PCE) data for May, which will be published at 12:30 GMT.
At press time, the US Dollar Index (DXY), which tracks the Greenback’s value against six major currencies, trades marginally lower around 101.52, but is still close to its over-a-year high at 101.80 posted on Wednesday.
Investors will pay close attention to the US PCE inflation data as it is expected to influence market expectations toward the Federal Reserve’s (Fed) monetary policy outlook. The US core PCE inflation, which is the Fed’s preferred inflation gauge, is expected to arrive higher at 3.4% Year-on-Year (YoY) from 3.3% in April.
Signs of price pressures accelerating would further boost hawkish Fed prospects. Currently, the CME FedWatch tool shows that the odds of the Fed hiking interest rates this year are almost 82%. While the possibility of at least two interest rate hikes is 42.2%.
FIIs continue to pare stake in Indian stock market
The lack of interest by overseas investors towards the Indian stock market remains intact despite oil prices having returned close to pre-war levels and the Reserve Bank of India pushing back fears of interest rate hikes in the near term.
On Wednesday, Foreign Institutional Investors (FIIs) offloaded their stake worth Rs. 1,843.40 crore in the Indian stock market. The same day, RBI Governor Sanjay Malhotra said, while speaking to ET Now, that it is “premature” to consider interest rate hikes, citing that the central bank doesn’t see signs of energy crisis-led inflation generalizing. "If we wanted to prepare the market for rate hikes, we would have changed stance from neutral to restrictive,” Malhotra added.
Technical Analysis: USD/INR stays under pressure below 20-day EMA
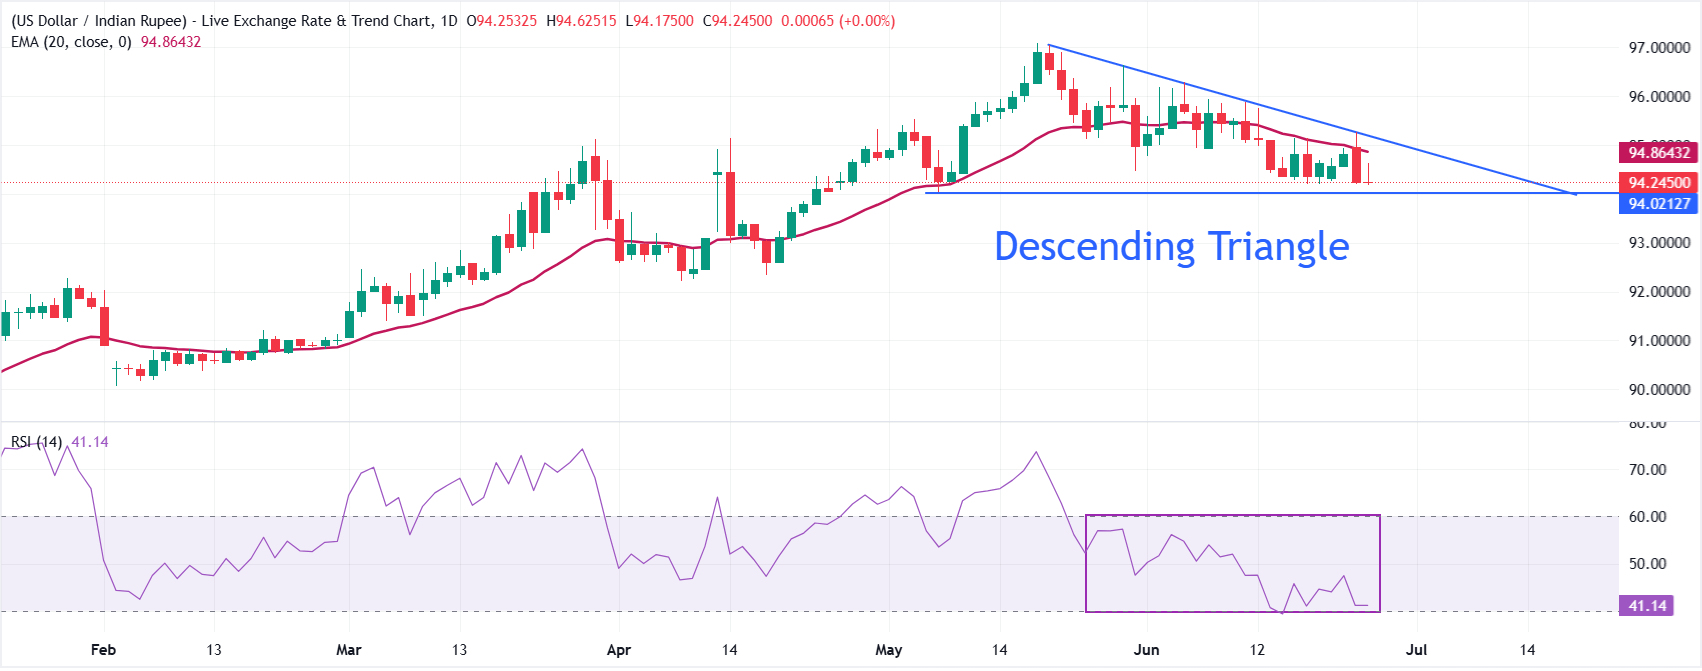
USD/INR trades lower at around 94.25, keeping a bearish near-term tone as spot holds decisively under the 20-day Exponential Moving Average (EMA) at 94.86.
The Relative Strength Index (14) around 41 suggests lingering downside pressure but without reaching oversold extremes, hinting that sellers still have the upper hand while leaving room for further extension before exhaustion signals emerge.
On the topside, initial resistance is provided by the 20-day EMA at 94.86, with the downward border of the Descending Triangle formation near 95.23 acting as the next cap, ahead of a more distant barrier around 97.0541 from the trend-line’s origin. Looking down, the pair would be exposed to the April 15 high at 93.67 if it extends its decline below the May 7 low at 94.03.
(The technical analysis of this story was written with the help of an AI tool.)
Economic Indicator
Core Personal Consumption Expenditures - Price Index (YoY)
The Core Personal Consumption Expenditures (PCE), released by the US Bureau of Economic Analysis on a monthly basis, measures the changes in the prices of goods and services purchased by consumers in the United States (US). The PCE Price Index is also the Federal Reserve’s (Fed) preferred gauge of inflation. The YoY reading compares the prices of goods in the reference month to the same month a year earlier. The core reading excludes the so-called more volatile food and energy components to give a more accurate measurement of price pressures." Generally, a high reading is bullish for the US Dollar (USD), while a low reading is bearish.
Read more.Next release: Thu Jun 25, 2026 12:30
Frequency: Monthly
Consensus: 3.4%
Previous: 3.3%
Source: US Bureau of Economic Analysis
After publishing the GDP report, the US Bureau of Economic Analysis releases the Personal Consumption Expenditures (PCE) Price Index data alongside the monthly changes in Personal Spending and Personal Income. FOMC policymakers use the annual Core PCE Price Index, which excludes volatile food and energy prices, as their primary gauge of inflation. A stronger-than-expected reading could help the USD outperform its rivals as it would hint at a possible hawkish shift in the Fed’s forward guidance and vice versa.
Author

Sagar Dua
FXStreet
Sagar Dua is associated with the financial markets from his college days. Along with pursuing post-graduation in Commerce in 2014, he started his markets training with chart analysis.
















