Indian Rupee gains despite renewed Middle East conflicts, US CPI eyed
- The Indian Rupee gains against the US Dollar despite renewed Middle East conflicts.
- The exchange of attacks between the US and Iran has renewed Middle East tensions.
- Investors await the US-India CPI data for May.

The Indian Rupee (INR) rises against the US Dollar (USD) on Wednesday after a flat opening. The USD/INR pair falls to near 95.15 even as Middle East tensions have flared up again, following the United States (US) retaliation against Iran over the shooting down of an American helicopter.
Renewed US-Iran tensions have offered support to oil prices. As of writing, the MCX Crude Oil contract expiring on June 18 is up 0.8% to near 8,490. Oil prices also clawed back half of their early losses on Tuesday after sliding to 8,212.
Currencies from economies, such as India, which rely heavily on oil imports to meet their energy needs, tend to underperform in a high oil price environment.
US strikes in retaliation for the shooting down of an Apache helicopter over Hormuz
On late Tuesday, the US Central Command (CENTCOM) announced that it launched a series of attacks on Iran’s air defense, ground control stations, and surveillance radar sites near the Strait of Hormuz, a vital passage to almost 20% of global energy supply. The US was expected to conduct military operations against Iran as President Donald Trump vowed retaliation for shooting down a US Apache helicopter over Hormuz.
In response, Iran has launched missiles on various US airbases in Jordan, Kuwait, and Bahrain, and has warned Washington to leave the Gulf region for their own safety.
“Powerful armed forces will not ignore any attack or threat,” Iran's Foreign Minister Abbas Araghchi said, adding, “Get out of our region if you want to be safe.”
FIIs remain net sellers on all trading days so far in June
Overseas investors continue to dump their stake in the Indian stock market, as Middle East tensions continue to hurt their sentiment towards risky assets. So far in June, Foreign Institutional Investors (FIIs) have remained net sellers on all trading days of June and have offloaded their stake worth Rs. 60,529.36 crore.
There has also been a slowdown in the pace of investment by retail investors in the Indian stock market through the mutual funds' route in May. According to data from the Association of Mutual Funds of India (AMFI), equity mutual fund inflows declined 40% month-on-month (MoM) to 229.08 billion rupees ($2.40 billion) in May,
Investors await US CPI data
Later in the day, investors will pay close attention to the US Consumer Price Index (CPI) data for May, which will be published at 12:30 GMT. The US Bureau of Labor Statistics (BLS) is expected to show that the headline CPI grew at an annualized pace of 4.2%, faster than 3.8% in April. In the same period, the core CPI – which excludes volatile food and energy items – is expected to have risen at a faster pace of 2.9% against the previous reading of 2.8%.
Signs of price pressures accelerating further would prompt expectations of the Federal Reserve’s (Fed) interest rate hikes for the year. As of now, the CME FedWatch tool shows that the odds of the Fed delivering at least one interest rate hike this year are almost 72%.
Meanwhile, India’s CPI data on Friday is expected to arrive higher at 4% YoY from 3.48% in April.
Technical Analysis: USD/INR reflects sideways trend within broader bullish structure
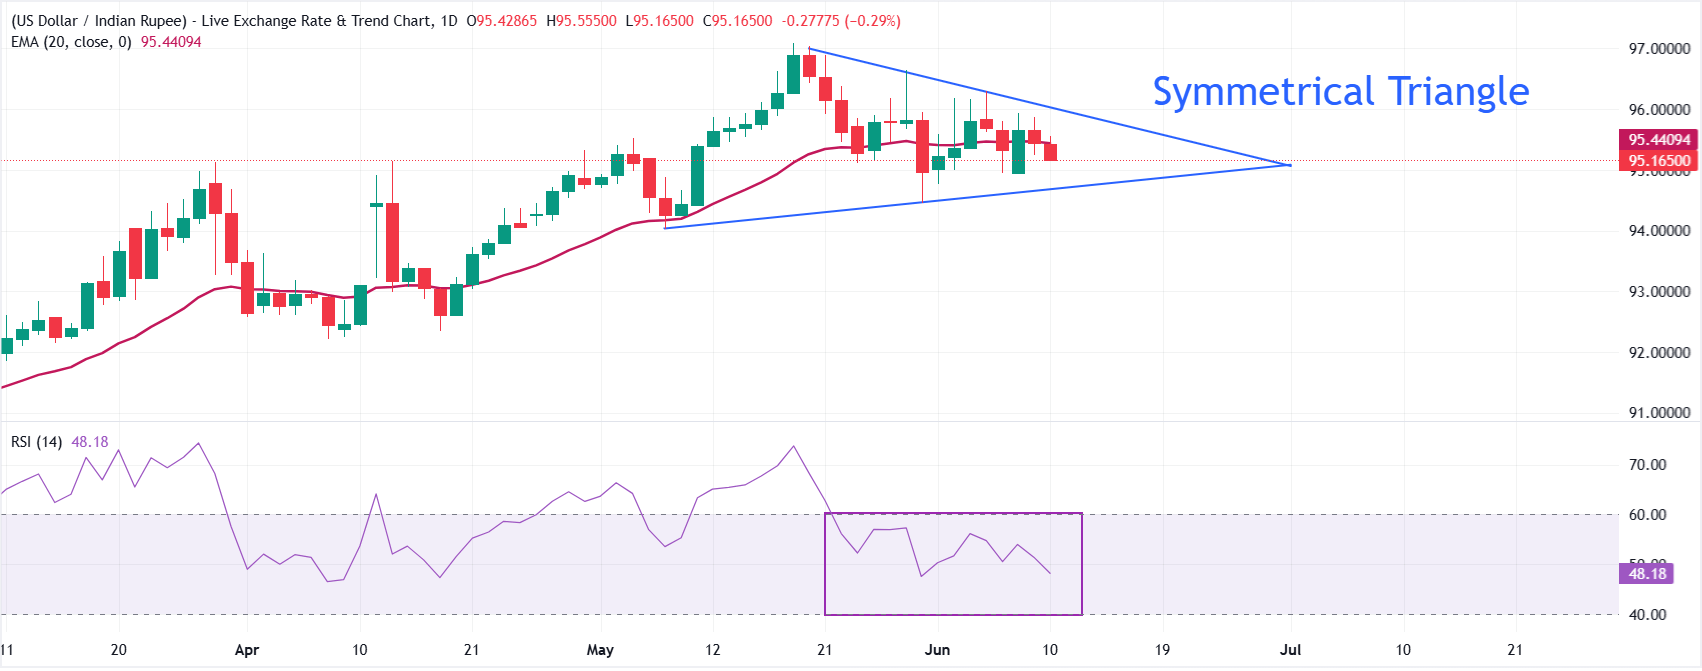
USD/INR falls to near 95.15 in afternoon trading hours in India. The Symmetrical Triangle formation and pair's stickiness to the 20-period Exponential Moving Average (EMA) at 95.46, reflects that the immediate trend has turned sideways.
The Relative Strength Index (RSI) wobbles inside the 40.00-60.00 zone, suggesting indecisiveness among investors.
On the topside, immediate resistance is located near the downward-sloping border of the above-mentioned chart pattern at around 96.00. A decisive break above 96.00 would open the door for further upside towards the all-time high at 97.10. On the downside, initial support is seen at the upward support trend-line break level near 95.04, ahead of the structural trend-line origin around 94.49; a sustained drop below these marks would open the way for a deeper corrective phase, while holding above them would keep the broader constructive pattern intact.
(The technical analysis of this story was written with the help of an AI tool.)
Economic Indicator
Consumer Price Index (YoY)
Inflationary or deflationary tendencies are measured by periodically summing the prices of a basket of representative goods and services and presenting the data as The Consumer Price Index (CPI). CPI data is compiled on a monthly basis and released by the US Department of Labor Statistics. The YoY reading compares the prices of goods in the reference month to the same month a year earlier.The CPI is a key indicator to measure inflation and changes in purchasing trends. Generally speaking, a high reading is seen as bullish for the US Dollar (USD), while a low reading is seen as bearish.
Read more.Next release: Wed Jun 10, 2026 12:30
Frequency: Monthly
Consensus: 4.2%
Previous: 3.8%
Source: US Bureau of Labor Statistics
The US Federal Reserve (Fed) has a dual mandate of maintaining price stability and maximum employment. According to such mandate, inflation should be at around 2% YoY and has become the weakest pillar of the central bank’s directive ever since the world suffered a pandemic, which extends to these days. Price pressures keep rising amid supply-chain issues and bottlenecks, with the Consumer Price Index (CPI) hanging at multi-decade highs. The Fed has already taken measures to tame inflation and is expected to maintain an aggressive stance in the foreseeable future.
Author

Sagar Dua
FXStreet
Sagar Dua is associated with the financial markets from his college days. Along with pursuing post-graduation in Commerce in 2014, he started his markets training with chart analysis.


