EUR/JPY Price Forecast: Cross consolidates under 187.00, bulls target 188.00
- EUR/JPY remains capped within 186.00-187.00 as intervention fears linger.
- RSI holds bullish territory, signaling buyers retain momentum advantage.
- Break above 187.00 exposes YTD high and 190.00 resistance.

The EUR/JPY consolidates around 186.00, edges down by 0.06% amid a souring of risk appetite amid the escalation of the US-Iran war, and strengthens safe-haven assets like the Japanese Yen.
EUR/JPY Price Forecast: Technical outlook
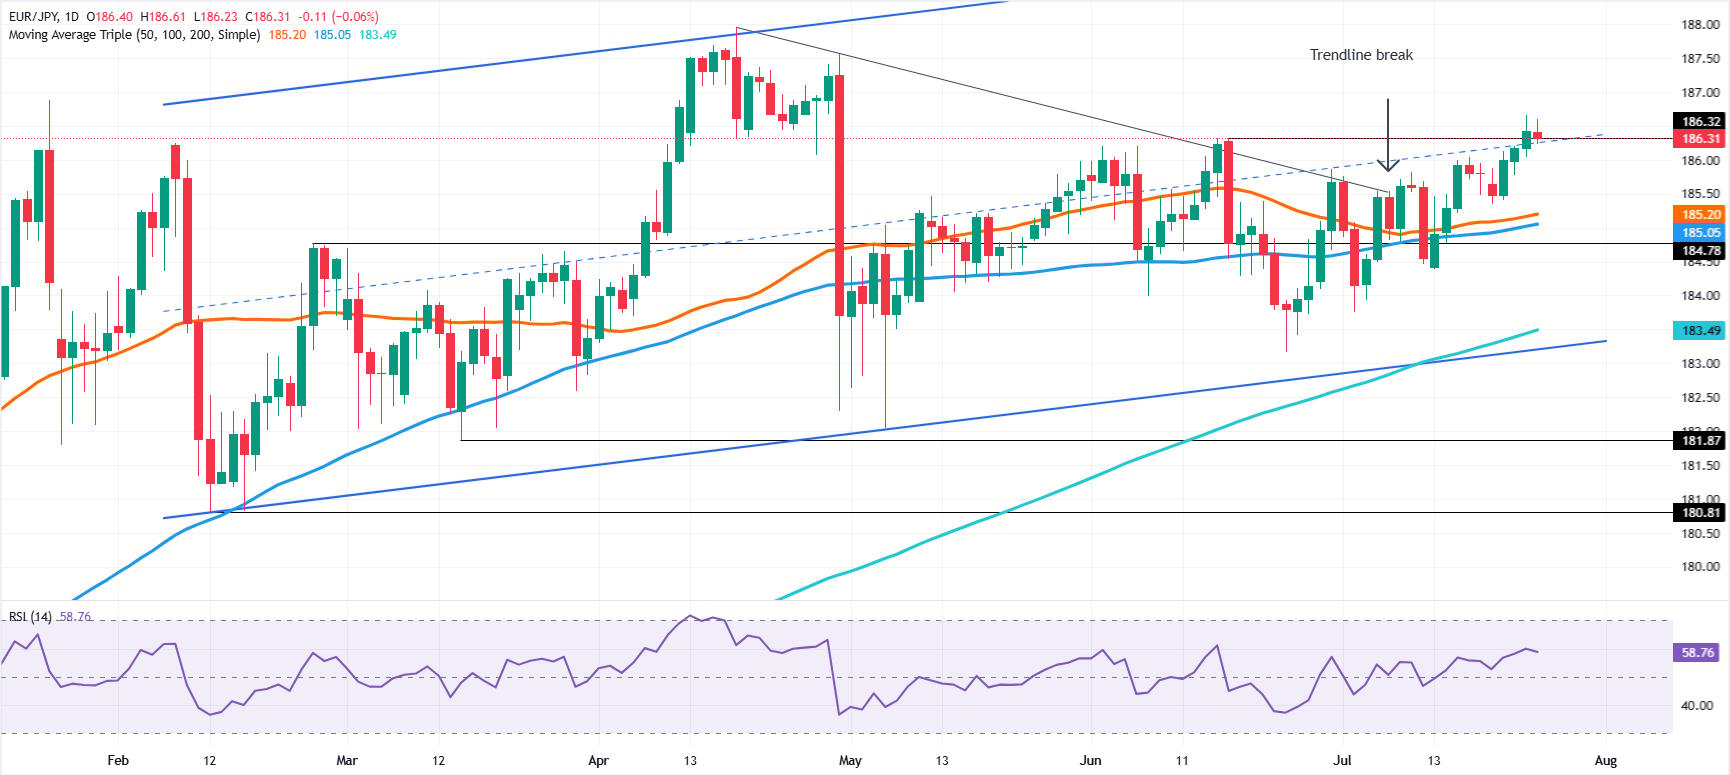
The EUR/JPY trades sideways after reaching the year-to-date (YTD) high of 187.95. The cross-pair dipped toward the 183.00 area following the Bank of Japan's (BoJ) last intervention, and since then buyers have reclaimed key resistance levels to reach the 186.00 mark.
At the time of writing, the EUR/JPY remains capped within the 186.00-187.00 range, amid fears that Japanese authorities could intervene in the foreign exchange markets. But bulls seem to be gaining momentum as indicated by the Relative Strength Index (RSI) in bullish territory.
Buyers need to clear 187.00 to challenge the YTD high at 187.95. Once those levels are taken out, the next resistance would be the 189.00 mark ahead of the 190.00 psychological level.
On the other hand, if sellers push the EUR/JPY below the July 20 low of 185.35, it exacerbates a move toward the 50-day Simple Moving Average (SMA) at 185.20, followed by the 100-day SMA at 185.05. Still lower lies the 200-day SMA at 183.29.
EUR/JPY daily price chart
Japanese Yen Price Today
The table below shows the percentage change of Japanese Yen (JPY) against listed major currencies today. Japanese Yen was the strongest against the Swiss Franc.
| USD | EUR | GBP | JPY | CAD | AUD | NZD | CHF | |
|---|---|---|---|---|---|---|---|---|
| USD | 0.02% | -0.04% | 0.00% | 0.07% | -0.17% | -0.25% | 0.19% | |
| EUR | -0.02% | -0.08% | -0.06% | 0.00% | -0.25% | -0.34% | 0.12% | |
| GBP | 0.04% | 0.08% | 0.04% | 0.11% | -0.16% | -0.22% | 0.22% | |
| JPY | 0.00% | 0.06% | -0.04% | 0.08% | -0.19% | -0.27% | 0.17% | |
| CAD | -0.07% | -0.01% | -0.11% | -0.08% | -0.27% | -0.35% | 0.10% | |
| AUD | 0.17% | 0.25% | 0.16% | 0.19% | 0.27% | -0.07% | 0.35% | |
| NZD | 0.25% | 0.34% | 0.22% | 0.27% | 0.35% | 0.07% | 0.43% | |
| CHF | -0.19% | -0.12% | -0.22% | -0.17% | -0.10% | -0.35% | -0.43% |
The heat map shows percentage changes of major currencies against each other. The base currency is picked from the left column, while the quote currency is picked from the top row. For example, if you pick the Japanese Yen from the left column and move along the horizontal line to the US Dollar, the percentage change displayed in the box will represent JPY (base)/USD (quote).
Author

Christian Borjon Valencia
FXStreet
Markets analyst, news editor, and trading instructor with over 14 years of experience across FX, commodities, US equity indices, and global macro markets.