IBEX 35 (Spain) index Elliott Wave technical analysis [Video]
![IBEX 35 (Spain) index Elliott Wave technical analysis [Video]](https://editorial.fxstreet.com/images/Markets/Equities/Industries/Media/AMC/AMC_stock_mobile_pc_candle_chart_USDollar_XtraLarge.jpg)
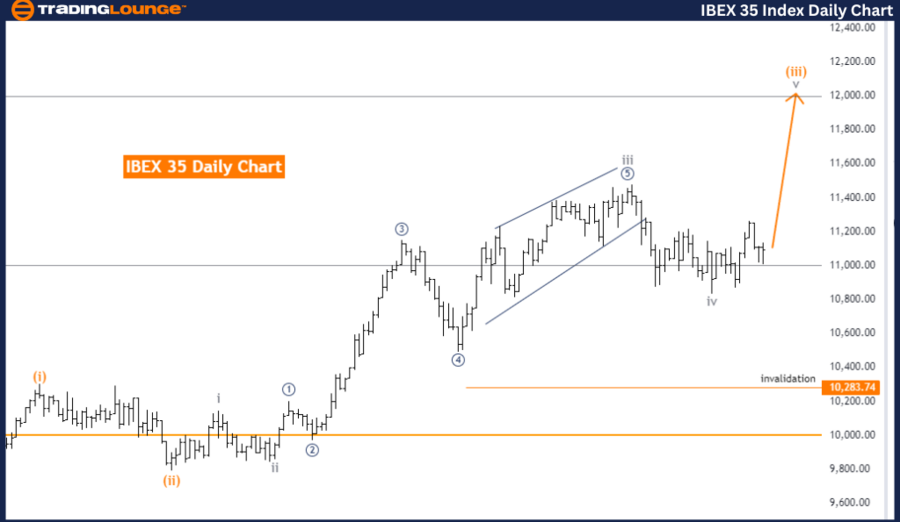
IBEX 35 (Spain) Elliott Wave Analysis Trading Lounge Day Chart.
IBEX 35 (Spain) Elliott Wave technical analysis
Function: Trend.
Mode: Impulsive.
Structure: Gray Wave 5.
Position: Orange Wave 3.
Direction: Next Lower Degrees: Orange Wave 4.
Details: Gray Wave 4 of 3 looking completed now, Gray Wave 5 is in play.
Wave cancel invalid level: 10283.74.
The IBEX 35 Elliott Wave Analysis for the daily chart provides insights into the trend of the Spanish stock market using Elliott Wave Theory. The primary function of this analysis is to track the ongoing trend. The mode identified is impulsive, which suggests strong and decisive price movements aligned with the broader market direction.
The specific wave structure under examination is Gray Wave 5, indicating the final leg in an impulsive wave pattern. Within this larger structure, the current position is Orange Wave 3, suggesting that the market is in the third wave of a smaller degree within the larger fifth wave.
The analysis identifies the next lower degree direction as Orange Wave 4, which will follow the completion of the current Orange Wave 3. This implies that after the completion of Orange Wave 3, a corrective wave, Orange Wave 4, is expected to commence, leading to a potential temporary pullback or consolidation in the market.
The details provided highlight that Gray Wave 4 of 3 appears to be completed, and now Gray Wave 5 is in play. This transition marks the movement from the fourth corrective wave to the final fifth impulsive wave in the current cycle. The completion of Gray Wave 4 of 3 indicates that the market has likely finished its correction phase and is now resuming its impulsive trend.
A crucial aspect of this analysis is the wave cancellation invalid level, set at 10283.74. This level serves as a critical threshold for validating or invalidating the current wave count. If the market price moves beyond this level, it would invalidate the current wave analysis, necessitating a reassessment of the market's wave structure. This invalidation level is essential for risk management and ensuring the accuracy of the wave analysis.
In summary, the IBEX 35 daily chart analysis indicates that the market is in an impulsive trend within Gray Wave 5 and Orange Wave 3. Following the completion of Gray Wave 4 of 3, the market is now progressing through Gray Wave 5. The analysis anticipates the next phase to be Orange Wave 4 after the completion of the current Orange Wave 3. The wave cancellation invalid level at 10283.74 is crucial for maintaining the validity of the current wave analysis and effective risk management.
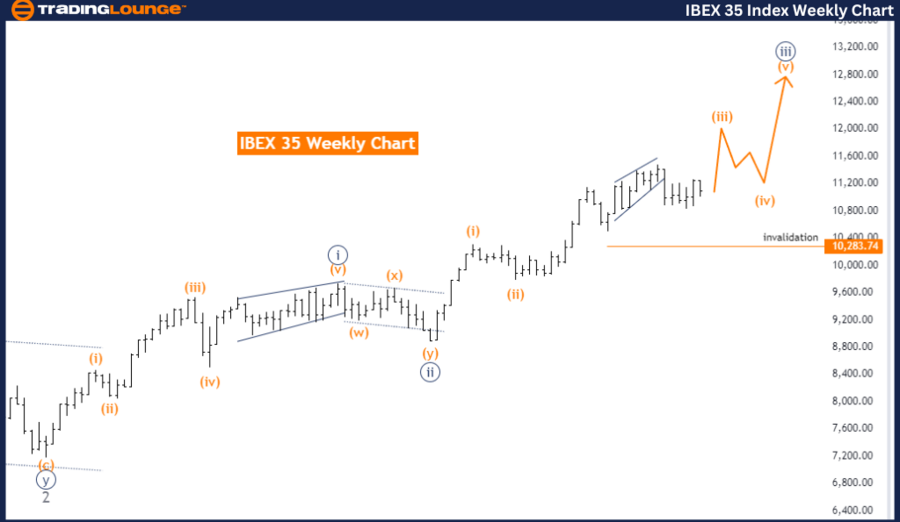
IBEX 35 (Spain) Elliott Wave Analysis Trading Lounge Weekly Chart.
IBEX 35 (Spain) Elliott Wave technical analysis
Function: Trend.
Mode: Impulsive.
Structure: Orange Wave 3.
Position: Navy Blue Wave 3.
Direction next lower degrees: Orange Wave 4.
Details: Now Orange Wave 3 of Navy Blue Wave 3 is in play.
Wave cancel invalid level: 10283.74.
The IBEX 35 Elliott Wave Analysis for the weekly chart focuses on the broader trend of the Spanish stock market using Elliott Wave Theory. The primary function of this analysis is to identify and follow the ongoing trend. The mode is impulsive, indicating strong and decisive movements in the market direction.
The specific wave structure under examination is Orange Wave 3, suggesting that the market is currently in the third wave of a larger impulsive sequence. Within this broader structure, the position is Navy Blue Wave 3, indicating that the market is in the third wave of a smaller degree within the larger Orange Wave 3.
The analysis identifies the next lower degree direction as Orange Wave 4. This means that after the completion of the current Orange Wave 3, a corrective wave, Orange Wave 4, is expected to begin. This would likely result in a temporary pullback or consolidation phase in the market.
The details provided highlight that Orange Wave 3 of Navy Blue Wave 3 is currently in play. This signifies that the market is progressing through the third wave of a smaller degree within the larger third wave. The ongoing movement indicates a continuation of the impulsive trend.
A critical aspect of this analysis is the wave cancellation invalid level, set at 10283.74. This level serves as a vital threshold for validating or invalidating the current wave count. If the market price surpasses this level, it would invalidate the current wave analysis, necessitating a reassessment of the market's wave structure. This invalidation level is essential for effective risk management and maintaining the accuracy of the wave analysis.
In summary, the IBEX 35 weekly chart analysis indicates that the market is in an impulsive trend within Orange Wave 3 and Navy Blue Wave 3. The current phase is Orange Wave 3 of Navy Blue Wave 3, suggesting ongoing strong market movements. The analysis anticipates the next phase to be Orange Wave 4 after the completion of the current Orange Wave 3. The wave cancellation invalid level at 10283.74 is crucial for maintaining the validity of the current wave analysis and ensuring effective risk management.
Technical analyst: Malik Awais.
IBEX 35 (Spain) Elliott Wave technical analysis [Video]
Author

Peter Mathers
TradingLounge
Peter Mathers started actively trading in 1982. He began his career at Hoei and Shoin, a Japanese futures trading company.


