|

H&R Block (HRB) stock: 20% plunge just broke a five-year trendline

H&R Block, the well-known leader in tax preparation services, has seen a painful, steep 20% decline since its earnings report on November 6th. The strange part? The company actually reported an earnings-per-share (EPS) beat on expectations and showed strong year-over-year operational improvement.

The main disappointment, which triggered this sharp sell-off, was the company’s decision to simply reaffirm its full-year guidance rather than raising it. In a bull market, not exceeding expectations can be penalized just as heavily as missing them entirely. This drop has now pushed HRB firmly into near-term oversold territory, making the technical picture particularly volatile.

The five-year trend is under attack

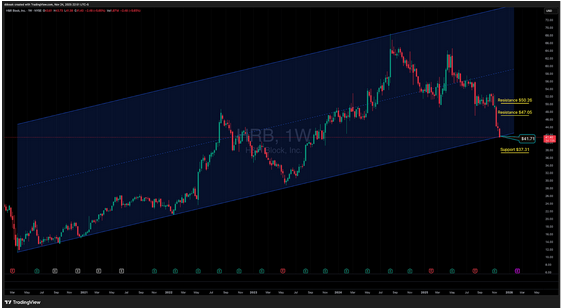
Our technical analysis reveals that HRB has been trading reliably within a well-defined inclining parallel channel ever since the market bottomed out following the Covid crash in March 2020.

However, this week’s aggressive drop has pushed the price just slightly beneath the bottom boundary of this critical, long-term parallel, which sits right around $41.71. A confirmed weekly close beneath this $41.71 level would signal a major, long-term break of trend. Should that confirmation occur, the next significant structural support target for HRB immediately drops to $37.31.

The oversold bounce scenario

Despite the severe technical breakdown, the stock is showing signs of being too cheap in the short term. The Relative Strength Indicator (RSI) on the weekly time frame currently sits at 26.94. Since anything below 30 is considered oversold, a significant near-term technical bounce is highly probable.

For those watching a potential bounce, the next key resistance level is $47.05. Since HRB closed Monday beneath that critical $41.71 parallel channel, a weekly close back inside the channel is mandatory to confirm the momentum reversal. If the stock manages to reclaim the channel this week, probabilities drastically increase for a re-test of $47.05, followed by the potential next level at $50.26.

Chart

Author

Drew Dosek

Drew Dosek

Verified Investing

Passionate technical and cycle analyst committed to empowering traders through data-driven insights.

More from Drew Dosek
Share:

Editor's Picks

AUD/USD stuck as the RBA talks tough into a slowdown

The Australian Dollar is going nowhere in a hurry, and the contradiction at its core explains why. The Reserve Bank of Australia keeps dangling the prospect of another hike, yet the economy it governs just expanded 0.3% in the first quarter, a clear step down from the prior pace. A central bank threatening to tighten into a visible slowdown is not a recipe for conviction in either direction, and the tape shows it.

USD/JPY: Japanese Yen coiled at the line, leaning on everyone but Japan

The Yen is doing very little, and that stasis is the whole story. USD/JPY sits glued near 160.00 not because Japan has found new strength, but because two outside forces are fighting to a draw over it: a US rate complex that keeps the dollar bid, and a Ministry of Finance that refuses to let the line break.

Gold declines below $4,500 on stalled US-Iran ceasefire talks, US NFP data looms

Gold price edges lower to near $4,470 during the early Asian session on Friday. The precious metal remains volatile amid ongoing geopolitical turmoil. Traders will closely monitor the developments surrounding the US-Iran peace deal and the US May employment report later on Friday. 


Bitcoin falls below $64K as demand turns negative, short-term holders' selling intensifies

Bitcoin has fallen below $64,000 on Thursday amid weakening market demand and mounting selling pressure from short-term holders. The leading cryptocurrency slipped toward the $63,000 level amid a broader risk-off environment, with several key metrics signaling one of the most challenging periods of the current market cycle.

Nonfarm payrolls: Testing the limits of Fed policy patience

The upcoming nonfarm payrolls report for May will provide the final update on the US labor market before Kevin Warsh attends his first policy meeting as the new Fed Chair later this month.

Recession on paper: What really moves the Canadian Loonie now?

Statistics Canada handed the headline writers a gift and the analysts a headache. Real GDP shrank 0.1% on an annualized basis in the first quarter, and with the fourth quarter of 2025 revised down to a 1.0% contraction, that is two negative quarters in a row, the textbook definition of a technical recession and Canada's first since the pandemic.