|

How did Gold Miners ($GDX) provide an intraday setup last week?

In today’s article, we will look at the past performance of the 1 Hour Elliottwave chart of $GDX. The rally from 3.09.2023 low unfolded as 5 waves which created a bullish sequence in our system. Therefore, we knew that the structure in $GDX is incomplete to the upside & should see more strength in 3, 7 or 11 swings against 3.06.2023 low. So, we advised members to buy the dips in 3, 7, or 11 swings at extremes. We will explain the structure & forecast below:

$GDX 1H pre-market chart 3.16.2023

Chart

Here is the 1H Elliottwave count from 3.16.2023. We were calling for the decline to find buyers in 3 swings at red B once the connector at ((b)) is in place.

$GDX 1H midday chart 3.16.2023

Chart

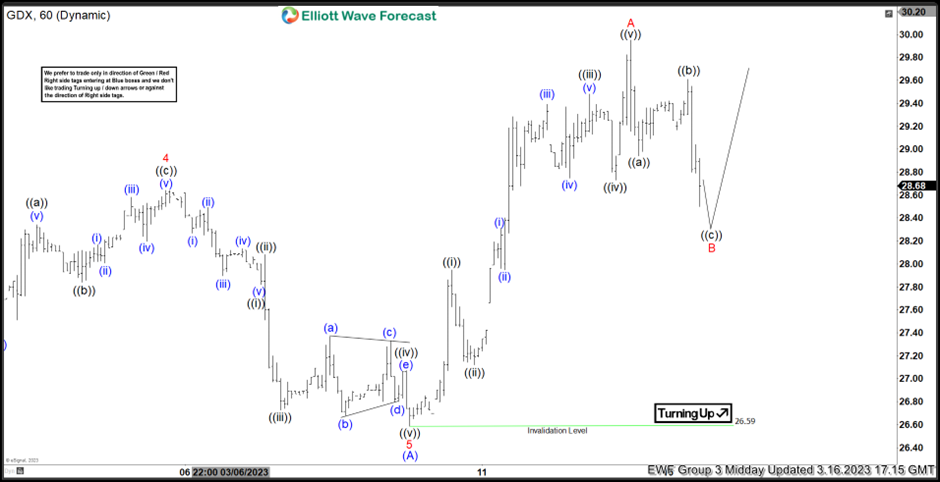
On the Midday update, the ETF was trading within the area and we gave out the signal live in the chatroom to enter at market price. The trade was journaled in our live trading room.

$GDX 1H chart 3.17.2023

Chart

Here is the latest 1H chart from 3.17.2023 showing the move taking place as expected. Within the course of 24 hours, The ETF has reacted higher after the 3 swing pullback as expected, breaking above the previous peak at red A. Members are now risk free shortly after taking the position. We like to remain long targeting the equal legs area at $31.80 from where a reaction lower can take place.

Author

Elliott Wave Forecast Team

Elliott Wave Forecast Team

ElliottWave-Forecast.com

More from Elliott Wave Forecast Team
Share:

Editor's Picks

EUR/USD holds above 1.1750 after mixed EU PMI data

EUR/USD manages to hold above 1.1750 but struggles to gather recovery momentum on Friday, following the mixed February PMI figures from Germany and the Eurozone. In the second half of the day, Q4 GDP, December inflation and February PMI data from the US will be watched closely by market participants.

GBP/USD recovers further toward 1.3500 after UK PMI data

GBP/USD is recovering ground further toward 1.3500 in European trading on Friday, helped by a modest uptick in the Pound Sterling after stronger-than-expected UK January Retail Sales and February PMI data. However, the pair's further upside could be limited amid persistent US Dollar strength as the focus turns to key US data. 

Gold sticks to positive bias above $5,000 ahead of US data

Gold gains some positive traction for the third consecutive day on Friday. holding above $5,000. Traders now look forward to the key US macro releases – the Advance Q4 GDP report and the Personal Consumption Expenditures (PCE) Price Index – for fresh trading impetus. 

US GDP growth expected to slow down significantly in Q4 after stellar Q3 

The United States Bureau of Economic Analysis will publish the first preliminary estimate of the fourth-quarter Gross Domestic Product at 13:30 GMT. Analysts forecast the US economy to have expanded at a 3% annualized rate, slowing down from the 4.4% growth posted in the previous quarter.

Iran tensions and AI fears at the forefront ahead of key US data

Thursday’s scorecard shows major US Stock benchmarks closed modestly in the red amid mounting US-Iran tensions and AI disruption worries. The S&P 500 shed 19 points (0.3%) to 6,861, the Nasdaq 100 lost 101 points (0.4%) to 24,797, and the Dow Jones Industrial Average dropped 267 points (0.5%) to 49,395.

Official Trump price approaches breakout with mixed signals from traders

Official Trump (TRUMP) is trading at $3.50 at the time of writing, approaching its upper consolidation range. A breakout from this range could open the door for an upside move. On-chain data shows market indecision, with balanced flows between bulls and bears, signaling a lack of clear directional bias.