Here is how to anticipate if a relief rally or a capitulation will show up in S&P 500 [Video]
![Here is how to anticipate if a relief rally or a capitulation will show up in S&P 500 [Video]](https://editorial.fxstreet.com/images/Markets/Equities/SP500/wall_street_nyse1-637299020939878938.jpg)
S&P 500 is testing the critical support with extreme oversold condition. Find out how to anticipate if there will be a relief rally or a breakdown with market capitulation to the downside.
Watch the video below and pay attention to the stats as reflected in the breadth thrust and also the one exceptional case as illustrated.
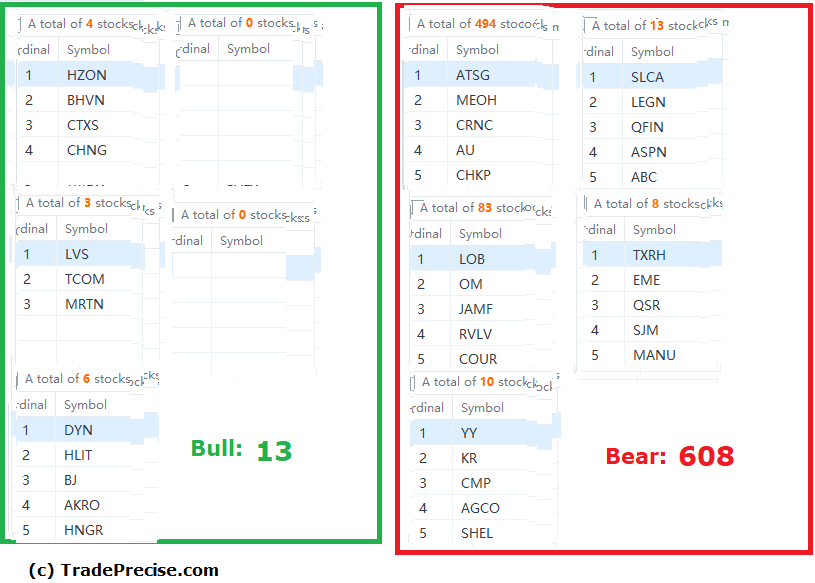
The bullish setup vs. the bearish setup is 13 to 608 from the screenshot of my stock screener below.
Most importantly, most of the outperforming stocks in the leading industry groups broke the key levels and violate the bullish structure as derived from the Wyckoff logic. Without the leading groups with outperforming stocks, the market bottom scenario will be violated.
Author

Ming Jong Tey
Independent Analyst
Ming Jong Tey has been trading since 2008. He started his learning journey from technical analysis (indicators, Fibonacci, etc...) to value investing. Throughout his journey, he develops an interest in price action with chart pattern trading.


