|

Here is a trading plan of reversal trading for S&P 500 at this axis area [Video]

After an impulsive down wave in S&P 500 after the FOMC rate hike, it is still testing the key area with possible more weakness ahead to be triggered by the coming CPI announcement.

Watch the video below to find out how you can take advantage with a simple trading plan to trade the reversal in S&P 500 at the key area with multiple timeframe analysis using Wyckoff method.

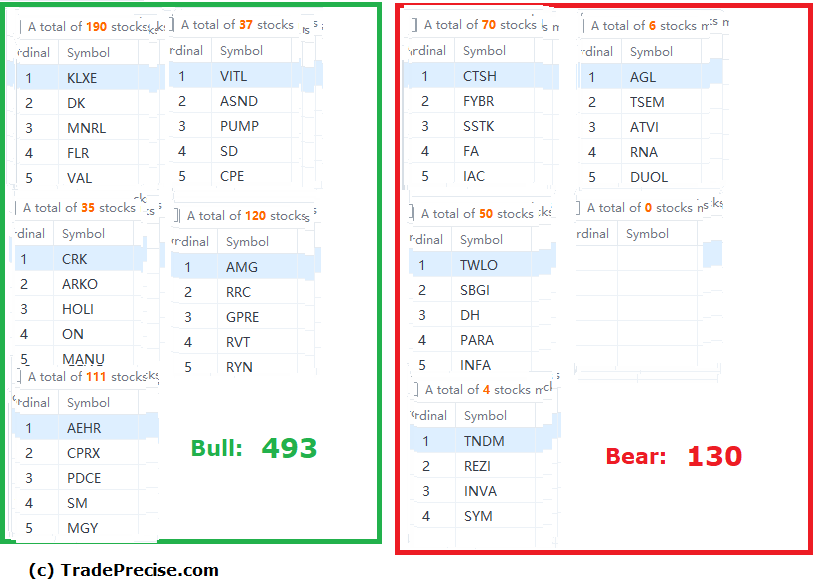
The bullish setup vs. the bearish setup is 493 to 130 from the screenshot of my stock screener below.

Chart

There is certainly smart money rotation from the Nasdaq into the Dow Jones, which is a typical sector rotation from growth into the value theme. There are many mega cap stocks from the hitting new high while some high reward to risk trade entry setup. These are still the outperforming stocks since the low formed in October and should be the one to focus when you are looking to find the winning stocks for swing trading.

Author

Ming Jong Tey

Ming Jong Tey

Independent Analyst

Ming Jong Tey has been trading since 2008. He started his learning journey from technical analysis (indicators, Fibonacci, etc...) to value investing. Throughout his journey, he develops an interest in price action with chart pattern trading.

More from Ming Jong Tey
Share:

Markets move fast. We move first.

Orange Juice Newsletter brings you expert driven insights - not headlines. Every day on your inbox.

By subscribing you agree to our Terms and conditions.

Editor's Picks

EUR/USD climbs toward 1.1800 as US employment data weighs on USD

EUR/USD gains traction and rises toward 1.1800 in the second half of the day on Tuesday. The US Dollar weakens and helps the pair stretch higher after the employment report showed that Nonfarm Payrolls declined by 105,000 in October before rising by 64,000 in November.

GBP/USD clings to gains above 1.3400

GBP/USD stays in positive territory above 1.3400 on Tuesday. The British Pound benefits from upbeat PMI data, while the US Dollar struggles to find demand following the mixed employment figures, allowing the pair to hold its ground.

Gold recovers to $4,300 area as markets assess US jobs data

Gold reverses its direction and recovers to the $4,300 area after spending the first half of the day under bearish pressure. The renewed US Dollar weakness after the jobs report showed that the Unemployment Rate climbed to 4.6% in November helps XAU/USD erase its losses.

US Nonfarm Payrolls expected to point to cooling labor market in November

The United States Bureau of Labor Statistics will release the delayed Nonfarm Payrolls (NFP) data for October and November on Tuesday at 13:30 GMT. Economists expect Nonfarm Payrolls to rise by 40,000 in November. The Unemployment Rate is likely to remain unchanged at 4.4% during the same period.

Ukraine-Russia in the spotlight once again

Since the start of the week, gold’s price has moved lower, but has yet to erase the gains made last week. In today’s report we intend to focus on the newest round of peace talks between Russia and Ukraine, whilst noting the release of the US Employment data later on day and end our report with an update in regards to the tensions brewing in Venezuela.

BNB Price Forecast: BNB slips below $855 as bearish on-chain signals and momentum indicators turn negative

BNB, formerly known as Binance Coin, continues to trade down around $855 at the time of writing on Tuesday, after a slight decline the previous day. Bearish sentiment further strengthens as BNB’s on-chain and derivatives data show rising retail activity.